Hurricane Season 2026: Why a “Below-Average” Forecast Is No Reason to Lower Your Guard
The 2026 Atlantic hurricane season is underway. NOAA’s official outlook projects a below-average season: 8 to 14 named storms, 3 to 6 hurricanes, and 1 to 3 major hurricanes, driven largely by the anticipated development of a strong El Niño pattern by late summer. Colorado State University has since revised its own forecast downward twice, and its July update now calls for 9 named storms, 4 hurricanes, and 1 major hurricane, which would make 2026 one of the quietest Atlantic seasons in more than a decade.

If those numbers feel reassuring, NOAA’s own administrator offered a corrective: “Even though we’re expecting a below-average season in the Atlantic, it’s very important to understand that it only takes one.”
The 1992 Atlantic season was a quiet one, producing just six named storms against a long-term average of fourteen. One of them was Hurricane Andrew, which made landfall in South Florida as a Category 5, destroyed or damaged more than 125,000 properties, and became the costliest natural disaster in U.S. history at the time. A “below-average” season that looked unremarkable on paper, produced a storm that reshaped the property insurance market.
Recent seasons have reinforced the same lesson, but from the other direction. The 2024 season delivered Helene, the deadliest storm since Katrina, with 251 lives lost and $78.7 billion in damages, and Milton, a Category 4 that struck near Sarasota with a $34.3 billion economic toll, alongside Beryl, Debby, and Francine. The 2025 season followed with 13 named storms, 5 hurricanes, and 4 major hurricanes, three of which reached Category 5 intensity. Whether a season is busy or quiet, the risk that matters is the single storm that finds your book.
The question for (re)insurers, MGAs, brokers, and risk managers is not whether this season will be active. It is whether their teams, data, and workflows are ready for the storm that does develop.
Preparedness Is Not a Storm-Season Activity
One of the clearest lessons from the teams that responded most effectively to Milton and Helene is also the simplest: the work that mattered most happened before the storm was named.
Most carriers and reinsurers have a documented catastrophe response plan that covers who is involved, what the steps are, and in what order. The harder question is whether that plan can be executed the moment a storm is named, because a plan is only as good as the data and workflows behind it.
All event response managers are aware of the feeling when a storm is forecasted to make landfall. There’s the stress of going through multiple rounds of portfolio updates and manually loading the latest forecast data to make sense of the forecasted impact. And if there’s even a single account or location that’s missing in the portfolio, it means doing the work all over again. Managing the demands of your reserving teams, claims teams, and the leadership, while ensuring accuracy, can be grueling.
You’re literally racing against time. And even if you complete getting the data together in time, there isn’t any time to do any second-order analytics to give some meaningful insights to your teams.
And this is despite having a ‘documented catastrophe response plan.’
It doesn’t have to be this way. The definition of the plan needs to evolve so your teams can get ahead of the storm.
What Getting Ahead of the Storm Actually Requires
The pre-storm window is the most underused period in the hurricane response calendar. There are three areas worth attention now, so that your team is ready for the demands that arrive once a storm makes landfall.
The first priority is exposure data. A current, well-structured portfolio is the foundation for everything that follows, from impact analyses and loss estimates to alert relevance and adjuster deployment. Data augmentation partners can fill gaps in COPE information, including building characteristics, roof geometry, replacement cost, and secondary modifiers. The more complete that picture is before a storm develops, the less time the team spends answering basic questions about what is actually at risk.
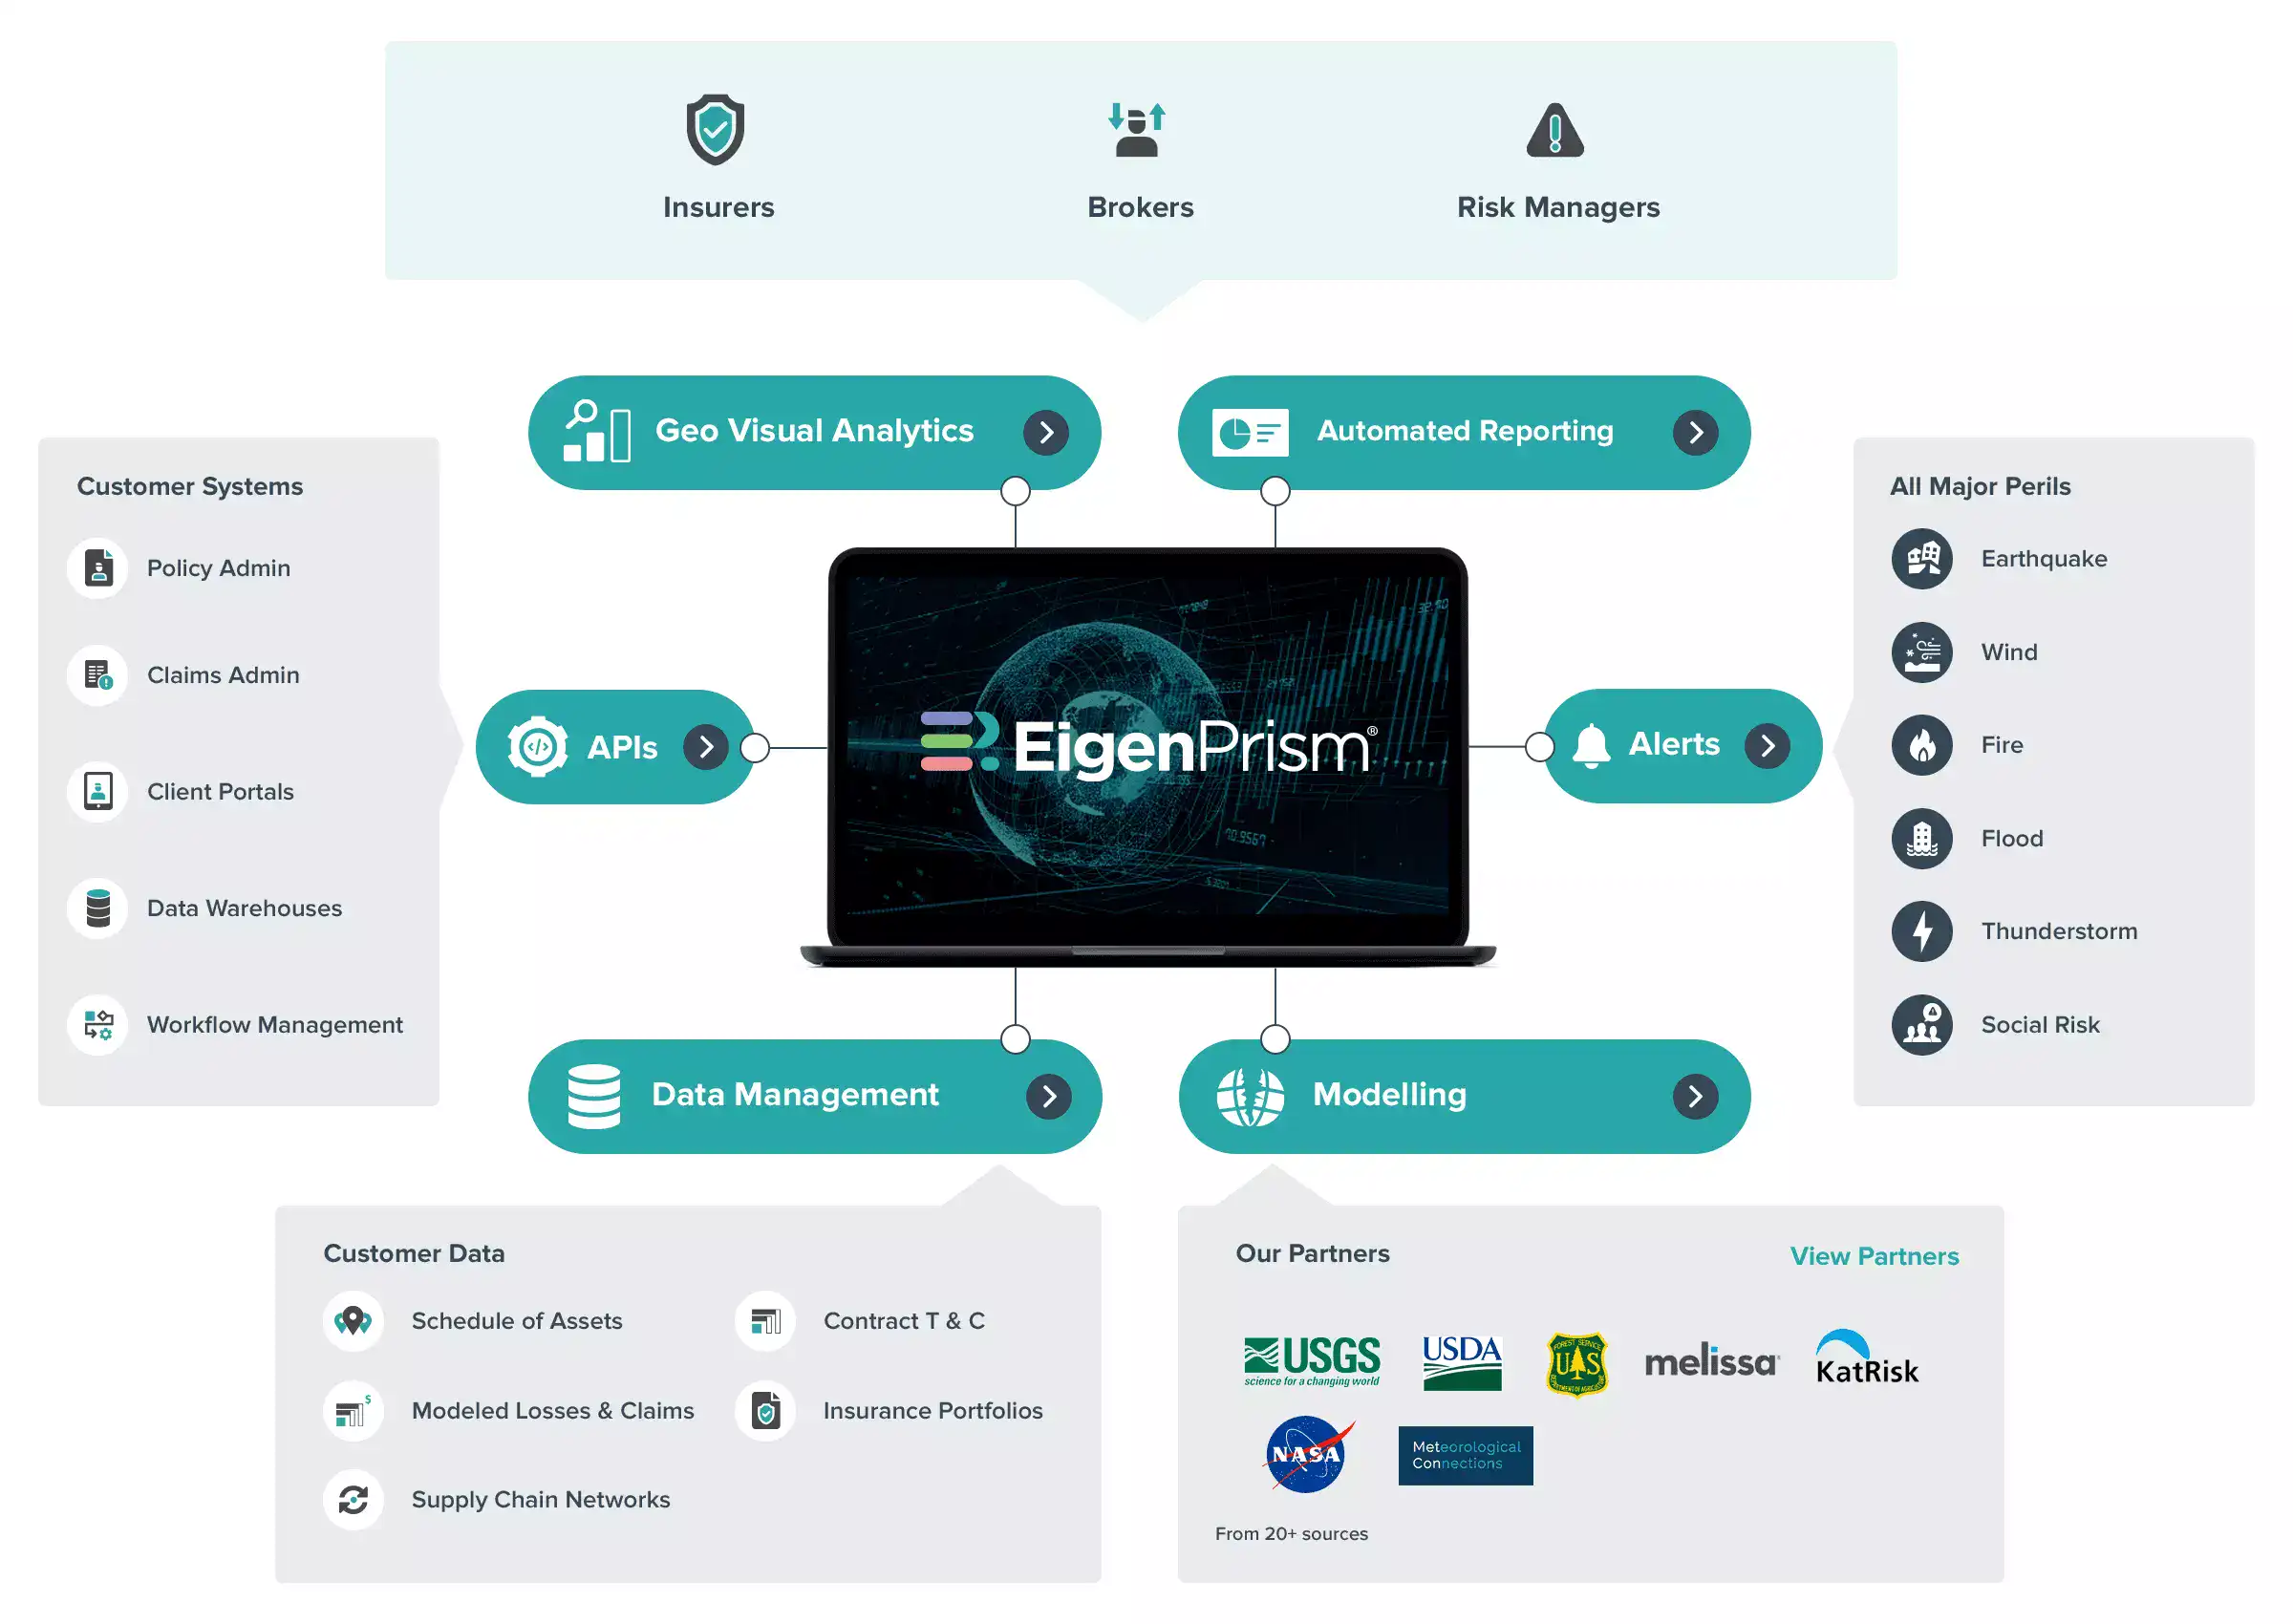
The second is setting up automated notifications for events that impact your portfolio. In the days preceding the landfall, constantly looking for the latest forecast data to update your analyses is not practical. An automated monitoring system immediately uses the latest forecast data, runs it against your book, and notifies you via email or mobile app notifications about the estimated exposure.
The third is knowing the workflows before they are needed. EigenPrism pre-populates forecast and post-event impact report templates for every named storm as it develops, and those templates pull the most current footprint data automatically, so teams do not need to rebuild them with each update. The portfolio view gives brokers and carriers a top-down picture of all exposures in the system, which lets them identify which clients are in a storm’s path before the first alert fires. Pre-landfall scenario analysis, which runs historical storm footprints such as Ian, Irma, or Milton against current portfolios, lets teams stress-test their position and set moratorium thresholds before the storm is real.
The most prepared organizations use this intelligence to drive operational decisions like gauging a storm’s likely severity early, identifying when a major impact is forecast for a metropolitan area where exposure is concentrated, and mobilizing resources accordingly, well before landfall.
After Landfall: The Data That Narrows the Uncertainty
Post-event is where data quality separates informed response from guesswork. In the 24 hours after a storm, every claims team and underwriter is asking the same thing: where did the damage actually occur, and how bad is it?
For teams relying on public data and manual workflows, answering that question can take days: sources have to be gathered and reconciled, formal damage surveys have to come in, and the exposure picture gets pieced together by hand while the pressure mounts. It no longer has to work that way. High-resolution post-event data is now commercially available within hours of a storm passing, from 3-second peak gust maps and property-level storm surge depth to flood inundation extent and aerial imagery flown immediately after landfall. That imagery makes a direct before-and-after comparison possible, showing a property earlier in the season against the same property days after the storm, without waiting on a formal survey to confirm what happened. The inland flooding from Helene in Asheville, North Carolina is the clearest recent example of why this matters. Few anticipated catastrophic flooding that far inland as a realistic scenario for that storm. For Cat response teams working from pre-landfall track data alone, the flood extent was a surprise, whereas for teams with post-event inundation data overlaid against their portfolio, the picture was visible and actionable.
The Competitive Dimension
The claims teams that reach an impacted policyholder first, with accurate information about what happened, a clear picture of the damage, and a ready response, shape the entire claims process that follows. The teams still reconstructing their exposure picture when the phone starts ringing are already behind.
Consider the dynamics of post-event cost. Pricing and demand surge in the days after a major storm, and organizations without arrangements already in place, end up at the mercy of the marketplace. The ones that locked in terms beforehand, including rates, vendors, and response plans, are not negotiating from a position of scarcity. The same principle applies to the insurance relationship. The broker or carrier that kept portfolio data current, configured alerts in advance, and delivered the first post-event report to a client, before a claim was filed, has positioned itself very differently from the one still pulling files. Speed is a real differentiator in a market where policyholders have choices.
The Season Is Underway, and the Window to Prepare Is Narrowing
Below-average forecasts have produced some of the most consequential storms in the history of the U.S. insurance industry, and a quiet outlook does not mean an uneventful one. If anything, a below-average forecast raises the risk of being caught unprepared, because it tends to lull teams into lowering their guard right up until a storm is close. Atlantic activity typically peaks between mid-August and October, which means the most dangerous weeks of the season are still ahead. What should not be left to chance is whether your data, your alerts, and your workflows are ready before the next storm develops.
For EigenPrism Users
Read the updated preparedness guide.
The EigenRisk hurricane season blog has been updated for 2026 with exact steps for getting EigenPrism ready before a storm develops, from loading and augmenting your portfolio, to configuring alerts, to running pre-landfall scenario analyses and accessing post-event data sets. If you are a current EigenPrism user, this is your pre-season checklist.
Read the 2026 Hurricane Preparedness Guide
Talk to your customer success team.
If you want a live walkthrough of how to set up portfolios, configure alerts, or run a scenario against your own exposure data, reach out directly or email prism.support@eigenrisk.com.
Webinar Update

Live webinar, July 28: Hurricane Response: What We Wish People Knew
When a hurricane is bearing down, two questions decide your response: can you get to the right data in time, and do you trust it when you do? Paola Iacobelli of QBE, Steven Sanders of ICEYE, and Nico Bruneau of Reask break down how to source, reconcile, and act on catastrophe data before, during, and after landfall, including where response tends to break down and how to recover when it does. If event response is on your plate this season, this is worth an hour.