Winter Storm Fern Exposes the Manual Cat Response Trap: Why Legacy Tools Leave Commercial P&C Professionals Scrambling
As Winter Storm Fern continues to hammer the United States, commercial property and casualty professionals face a stark reality: the tools many rely on weren’t built for events of this scale and complexity.
This storm spans over 2,000 miles from Texas to Maine and has already triggered emergency declarations in more than 22 states, left over 1 million customers without power, and affected approximately 230 million people. Industry analysts suggest this could be a billion-dollar insured loss event. As of Sunday, January 25 when this piece was written, snow totals had reached 13 inches in Indiana and 12 inches in Missouri. The Northeast was bracing for 8-12 inches in New York City with up to 20 inches possible in Boston.
For portfolio managers, claims professionals, and catastrophe risk analysts, the question isn’t whether they’ll be affected. It’s whether their tools can keep pace with a multi-peril event that’s still evolving.
The Scale of Commercial Exposure
Winter Storm Fern presents a uniquely challenging commercial property event. Unlike a hurricane with a defined cone, this storm combines heavy snow accumulation across the Midwest and Northeast, significant ice accretion across the Deep South (historically the peril that generates outsized losses), prolonged sub-freezing temperatures with some areas remaining below freezing for nearly 100 consecutive hours, and multi-state business interruption as major metros from Dallas to Boston face operational disruptions. And, we all know it takes far less than 100 hours of below freezing temps to freeze pipes and cause damage (remember what we saw in Texas in 2019?).
For commercial portfolios, the exposure isn’t just property damage. It’s the cascade: frozen pipes leading to water damage, ice-laden power lines causing outages that trigger spoilage claims, roof collapses from snow loads, and business interruption that compounds as restoration timelines stretch due to extreme cold.
According to an ERGO NEXT survey, more than half of small business owner respondents admitted that they don’t feel adequately insured, with 48% of restaurant owners alone reporting winter weather-related damage to their operations.
Why Legacy Tools Fail: The Fragmented Data Problem
Most catastrophe response workflows share a common limitation: professionals are forced to pull data from multiple disconnected sources and manually piece together a picture of their exposure.
When a storm spans 2,000 miles and affects 35+ states, toggling between weather feeds, exposure databases, hazard maps, and portfolio systems creates dangerous delays. By the time you’ve assembled a complete view, conditions have changed. And the manual cross-referencing required to connect weather data to your specific portfolio locations? That’s where hours disappear and blind spots emerge.
The data hierarchy matters:
- Data tells you a storm exists.
- Information tells you where it’s headed.
- Analytics tells you which assets are exposed.
- Actionable analytics tells you exactly what to do about specific locations right now.
The challenge isn’t that the data doesn’t exist. Weather services, hazard models, building characteristics, pipe freeze indicators, historical loss patterns: this information is available. The problem is accessing all of it in one place, in the context of your specific portfolio, with analytics capabilities that translate raw inputs into clear decisions.
When your workflow requires pulling from a dozen different systems and manually reconciling the results, you’re not doing catastrophe response. You’re doing data entry and manipulation while the storm moves.
The Speed Imperative: Unified Data, Faster Decisions
Effective catastrophe response requires getting the right information to the right people fast enough to act. That means eliminating the friction between data and decision.
Consider pipe freeze risk during this storm. Areas of North Texas could remain below freezing for nearly 100 consecutive hours. Understanding which locations in your portfolio face elevated freeze risk requires synthesizing temperature data, building characteristics, and exposure information. If that synthesis happens manually across multiple systems, you’re working with yesterday’s risk picture as conditions evolve.
A platform that brings 40+ data sources together in one environment, automatically overlays them against your portfolio, and surfaces the locations that need attention transforms the workflow. Instead of assembling data, you’re acting on it. Instead of wondering which accounts might be affected, you’re seeing exactly where your concentration sits.
This unified approach creates competitive advantage. When fragmented workflows force slow, reactive responses, integrated analytics enable proactive management. You see the exposure before losses are reported. And even if you are lucky enough to avoid large losses, you understand concentration risk before it surprises you with the next event.
What This Means for Your Role
For Portfolio Managers: Understanding Concentration in Real Time
As Winter Storm Fern moves through your book, the critical questions are: Where are your geographic clusters? Which locations face the highest probability of loss? Where does your exposure concentration create aggregation risk?
The winter storm challenge: With a 2,000-mile footprint affecting accounts from Texas to New England, understanding real-time portfolio impact requires dynamic exposure profiling, not static snapshots that were accurate last quarter.
What unified analytics enables:
- Identifying which specific locations within multi-location accounts face elevated pipe freeze, ice, or snow load risk.
- Understanding aggregation patterns that may not be visible in standard reports.
- Providing intelligence to leadership about where concentration risk is highest.
- Demonstrating portfolio quality to capacity providers with precise, current exposure data.
For Claims Professionals: Proactive Response, Not Reactive Scrambling
Claims response effectiveness depends on knowing where losses will occur before they’re reported. Waiting for the phone to ring means you’re already behind.
The winter storm challenge: With multiple perils developing simultaneously (ice in the South, heavy snow in the Northeast, pipe freeze risk across the footprint) deployment decisions require understanding which areas will generate the heaviest claims volume.
What unified analytics enables:
- Pre-positioning adjusters based on precise impact projections, not broad regional estimates.
- Prioritizing response to highest-severity locations within the footprint.
- Tracking the event as it develops to adjust deployment in real time.
- Reducing cycle times by anticipating claims before they’re filed.
For Catastrophe Risk Analysts: “Right-Sized” Modeling That Keeps Pace
Cat risk analysts understand the limitations of legacy modeling tools. When conditions change faster than models update, analysis becomes an exercise in documenting what happened rather than informing what to do.
The winter storm challenge: Winter Storm Fern’s combination of perils (snow, ice, freeze) requires synthesizing multiple data streams into actionable output. Generic winter storm models miss the nuance that drives actual loss.
What unified analytics enables:
- Scenario modeling that reflects current conditions across multiple perils.
- Access to specialized data sources like pipe freeze probability that synthesize multiple variables into actionable risk indicators.
- Dynamic updating as the event evolves rather than waiting for post-event analysis.
- Translating complex multi-peril exposure into clear recommendations for leadership.
Real-World Application: This Storm, Right Now
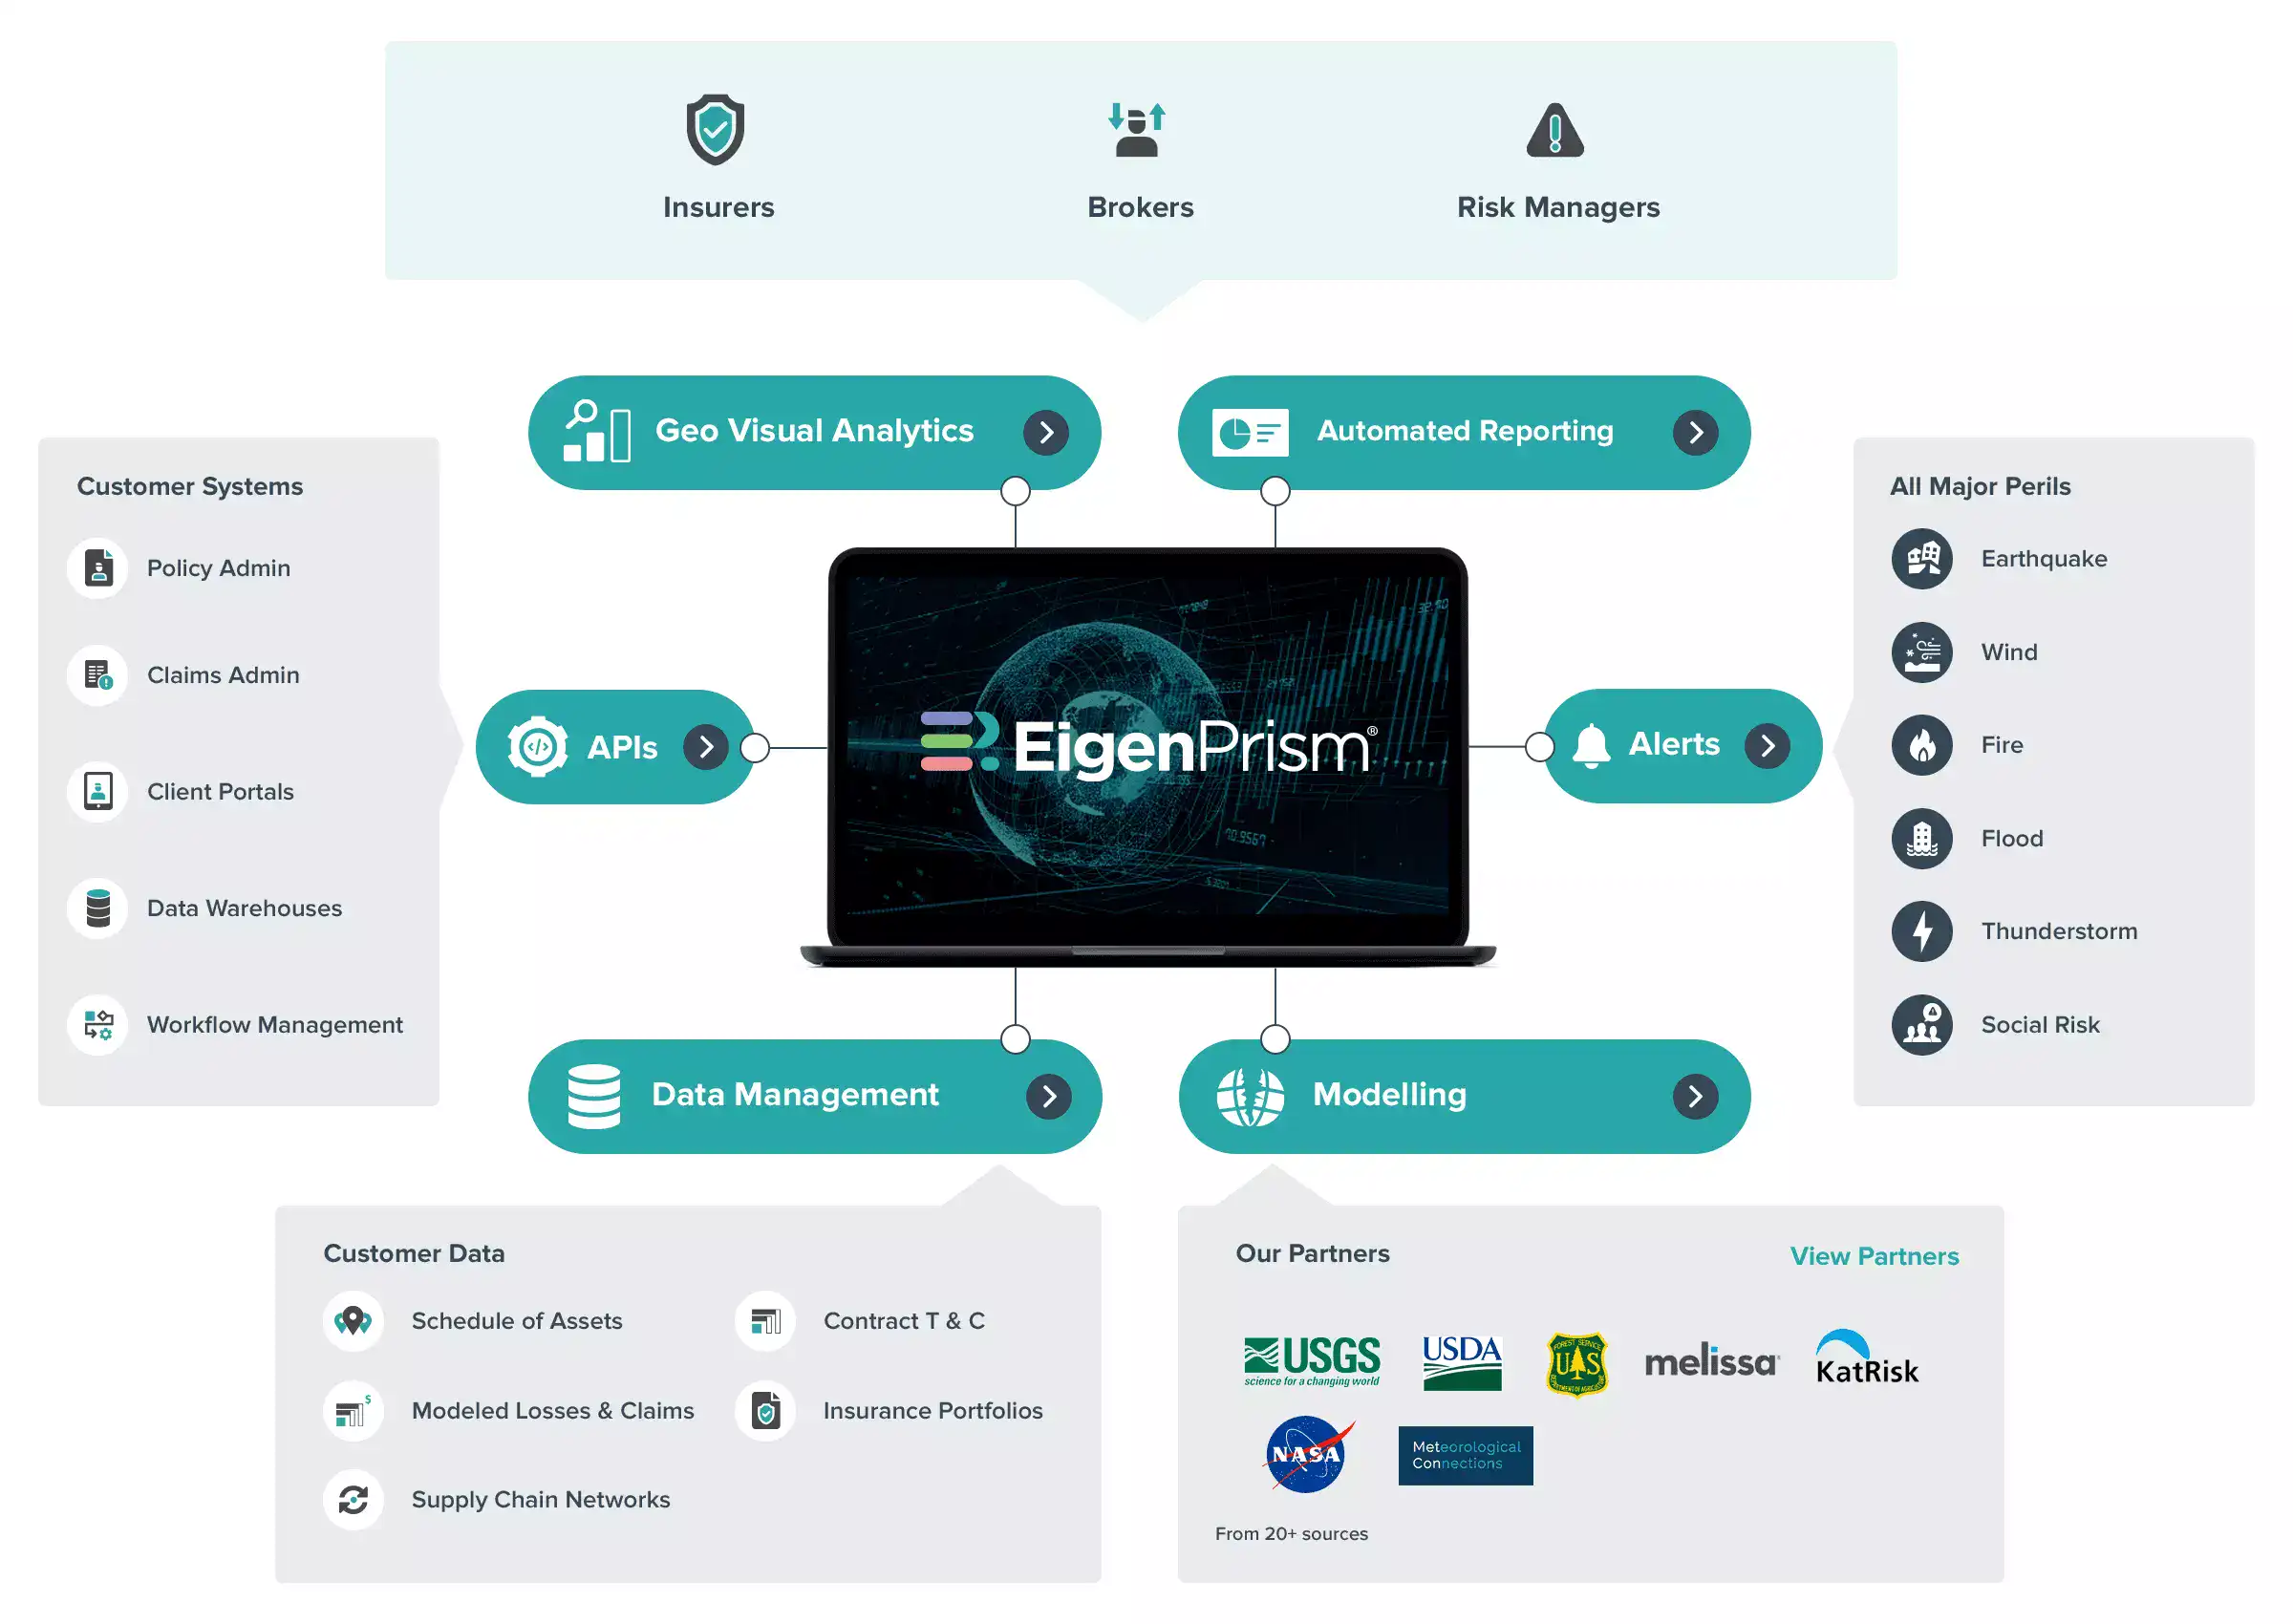
EigenPrism’s integration with Adiabat pipe freeze data, along with multiple footprints from NWS including 72-hour forecasts for freezing rain and snow accumulation, potential overall winter storm impact, potential snow amount impact, snow load impact, ice accumulation impact, and blowing snow impact illustrates the value of unified access. Rather than showing “cold weather in Texas,” the platform provides probabilities that are auto-updating with the latest available data, helping portfolio managers understand which locations face elevated risks as conditions evolve.
The platform’s automated alert system monitors triggering events continuously, notifying professionals when conditions change at specific locations in their portfolio. Claims teams receive alerts before losses are reported. Portfolio managers see concentration shifts in real time. Cat risk analysts access the data they need to update leadership without manual data pulls.
With more than 4,000 historical planning scenarios across multiple perils, and data augmented from 40+ public and private sources, EigenPrism transforms catastrophe response from reactive scrambling to proactive management.
The Bottom Line
Winter Storm Fern is testing catastrophe response capabilities across the industry right now. The professionals who will navigate this event most effectively are those with tools that bring everything together: multiple data sources in one platform, automatic portfolio overlay, and analytics that translate information into action.
The question isn’t whether your portfolio has exposure to this storm. With 230 million people affected across 22+ states, nearly everyone does. The question is whether you can see your complete risk picture fast enough to act on it before losses compound.
EigenPrism delivers unified catastrophe intelligence for commercial property and casualty professionals, bringing 40+ data sources together in one platform. Contact us to learn how actionable analytics can transform your catastrophe response.