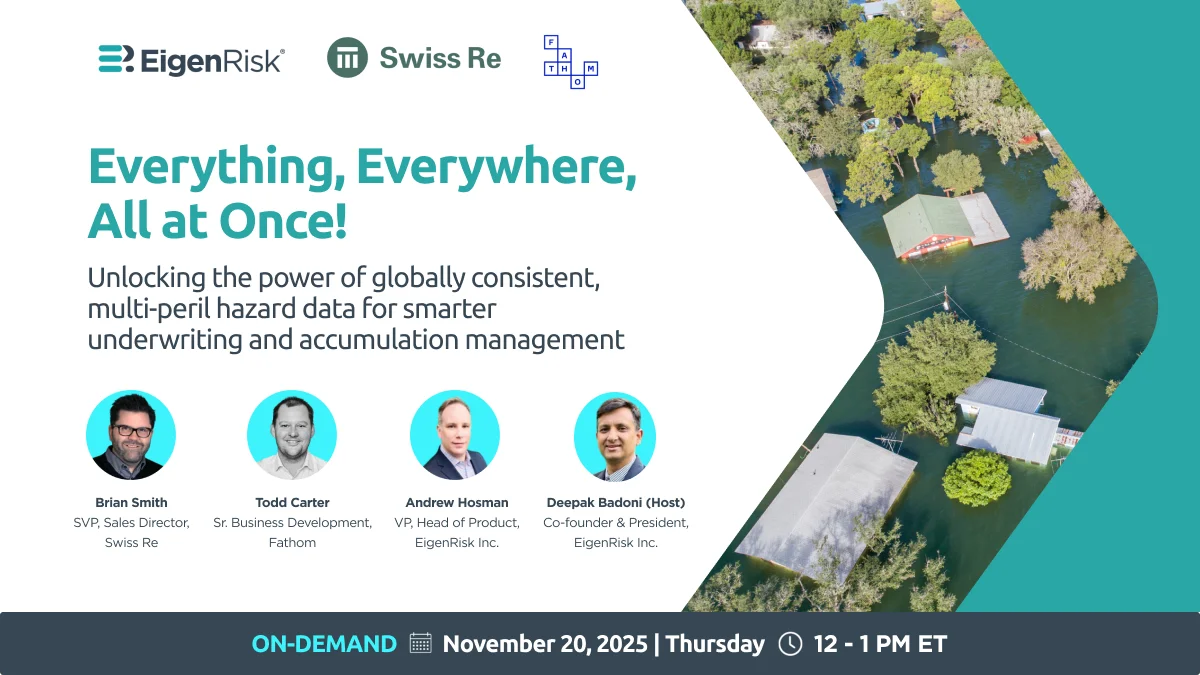
Everything, Everywhere, At All Once
Unlocking the power of globally consistent, multi-peril hazard data for smarter underwriting and accumulation management.
With the occurrence of large-scale natural catastrophe events becoming more frequent and unpredictable around the world, property and casualty insurers need better and more timely access to accurate event forecasts and footprints.
During a recent webinar hosted by Deepak Badoni, co-founder, EigenRisk, Inc., Brian Smith, SVP, Sales Director, Swiss Re and Todd Carter, Sr. Business Development, Fathom shared their perspectives on how catastrophic risk is evolving.
They also discussed the latest resources available to risk and insurance professionals to assess and respond to these exposures with greater speed and precision.
Record-breaking insured losses
Smith said that 2024 saw a new record for disasters with more than 150 insured loss-inducing natural catastrophes. The resulting global economic loss was 25% higher than normal. Notably, 60% of these insured losses in 2024 were driven by so called secondary perils – wildfire, flooding and severe convective storms.
As an example of how major catastrophes have become more difficult to predict, he cited the widespread flooding that occurred in Ashville, NC from Hurricane Helene in September 2024, an inland area where the population was unprepared for 30 inches of rainfall in only a few days.
Similarly, in recalling the Park Fire, the fourth largest wildfire in CA state history, Smith observed how the sheer speed and scale of the event really hurt the initial suppression efforts that led to widespread destruction and forced thousands to evacuate their homes.
Of course, severe climate- and weather-related events continued into 2025 with multiple catastrophes, including the Palisades and Eaton wildfires in California, a highly active wildfire season in Canada, and major tornadoes such as a rare E5 and EF5 in North Dakota.
The past year witnessed numerous major flooding events, including the tragic Guadalupe River flood and a major flood in Milwaukee, Wisconsin this past summer.
Altogether, secondary perils accounted for as much as 70 percent of insured losses this year. It’s clear, Smith noted, that risk and insurance professionals need the timely insights required to manage catastrophe risks before they happen.
To that end, Smith stated that Swiss Re is actively supporting clients across insurance, the public sector and corporations in more than 150 countries. Their CAT perils team has built and continually updated data and models and tools for most of the global perils, including earthquake, tropical cyclone, flood (pluvial, fluvial and coastal), wildfire, lightning, hailstorm, landslide, volcano and tsunamis.
Part of Swiss Re’s Risk Data Solutions, the company’s CatNet platform offers 100 percent global coverage and provides a consistent view of risk globally, Smith said. He explained that all layers have been developed with consistent metrics to facilitate apples-to-apples comparisons for the same perils in different countries. Furthermore, Swiss Re is currently planning to add capability to apply consistent metrics to compare different perils.
Flood peril widespread and growing
Fathom joined the Swiss Re family in 2023 and provides comprehensive water risk on a global scale. Formed out of the University of Bristol in 2013, Fathom was created to bridge the gap between academia and flood models.
“Flood is the most prevalent natural disaster in the world and impacts a third of the world’s population,” said Carter. In recent years, it seems to be an increasing part of the public ‘s consciousness globally.
Striving for consistency
In evaluating natural catastrophe risk, Badoni emphasized the need for consistency.
“There’s a lot of talk about quantifying risk and absolute numbers,” he said. “Yet, there’s so much uncertainty that even with the best models .. sometimes you may not have as much confidence, but … you can do some relative ranking.”
He observed that a risk or insurance executive might overlay the USGS hazard map, for example, view their top locations based on their respective hazard zones, and then make decisions on a relative basis. While that approach might work in the U.S., for global portfolios, or even those with only a few locations or suppliers outside the U.S., you face a larger problem.
Badoni explained that in some instances insurance and risk executives may have access to public domain data to try to obtain a global view of earthquake risk, but the information likely hasn’t been updated since 1999. So, it’s limited for determining Peak Ground Acceleration (PGA) in comparison to what’s available in the U.S. Thus, a key challenge, said Badoni, is that “you can’t just take one data source and then mesh it with another data source and get some relevant analytics.”
He also cited discrepancies in the availability of wildfire data as another example. In the U.S. many of the public domain models are understandably “California heavy.” Outside the U.S., a public domain model in Australia excluded Western Australia.
To address these challenges, Smith explained how Swiss Re’s CatNet is structured for global consistency.
He said CatNet combines the Swiss Re hazard layers with selected background maps and satellite imagery. Then, all these hazard layers are developed with globally consistent intensity metrics by peril and use a 1-to-10 score.
Thus, clients can make apples-to-apples comparisons of earthquake risk in Japan with earthquake risk in California and be confident that they’re leveraging the same methodology.
CatNet also provides core hazard insights along with key exposure data points to help enhance the underwriting process. They include key COPE characteristics, such as construction, total building area, and replacement cost values.
CatNet also accommodates various peril-specific considerations, such as roofing characteristics (shape, material and condition) for severe convective storms. For flood risk, the data include first-floor height, which is critical for flood pricing and underwriting.
As a result, CatNet users today can visually analyze one or more hazard layers and measure that impact on their locations, Smith explained. “They can see historical events that may have impacted those locations and then access a supporting exposure data and climate risk data as well, all in one spot,” he added.
Overall, the CatNet platform enables users to perform both single-risk granular lookups or run larger schedules of locations … and to do so quickly.
For flood risk, Fathom’s terrain data set is known as FAB-Dem-Plus (FAB stands for “forest and buildings removed”; DEM is digital elevation model).
Carter said Fathom uses LIDAR with lasers on planes to scan the world. These enriched data are available in most developed markets, including the U.S., Western Europe, Japan, most of Australia and New Zealand.
Fathom then stitches that input together data with data obtained from satellites to create what Carter deems as the “best peer-reviewed terrain data available.” This, in turn, facilitates the creation of “really good” flood hazard maps.
Fathom also covers all sub-perils within flooding, such as pluvial, fluvial and coastal. In addition, a sub-section within Fathom’s Science team focuses strictly on climate.
“You can actually start to forward forecast and have a look at what will happen in a changing world – be it via urbanization or climate change – and that runs all the way to 2100,” Carter said.
Accessing CatNet and Fathom on EigenRisk’s platform
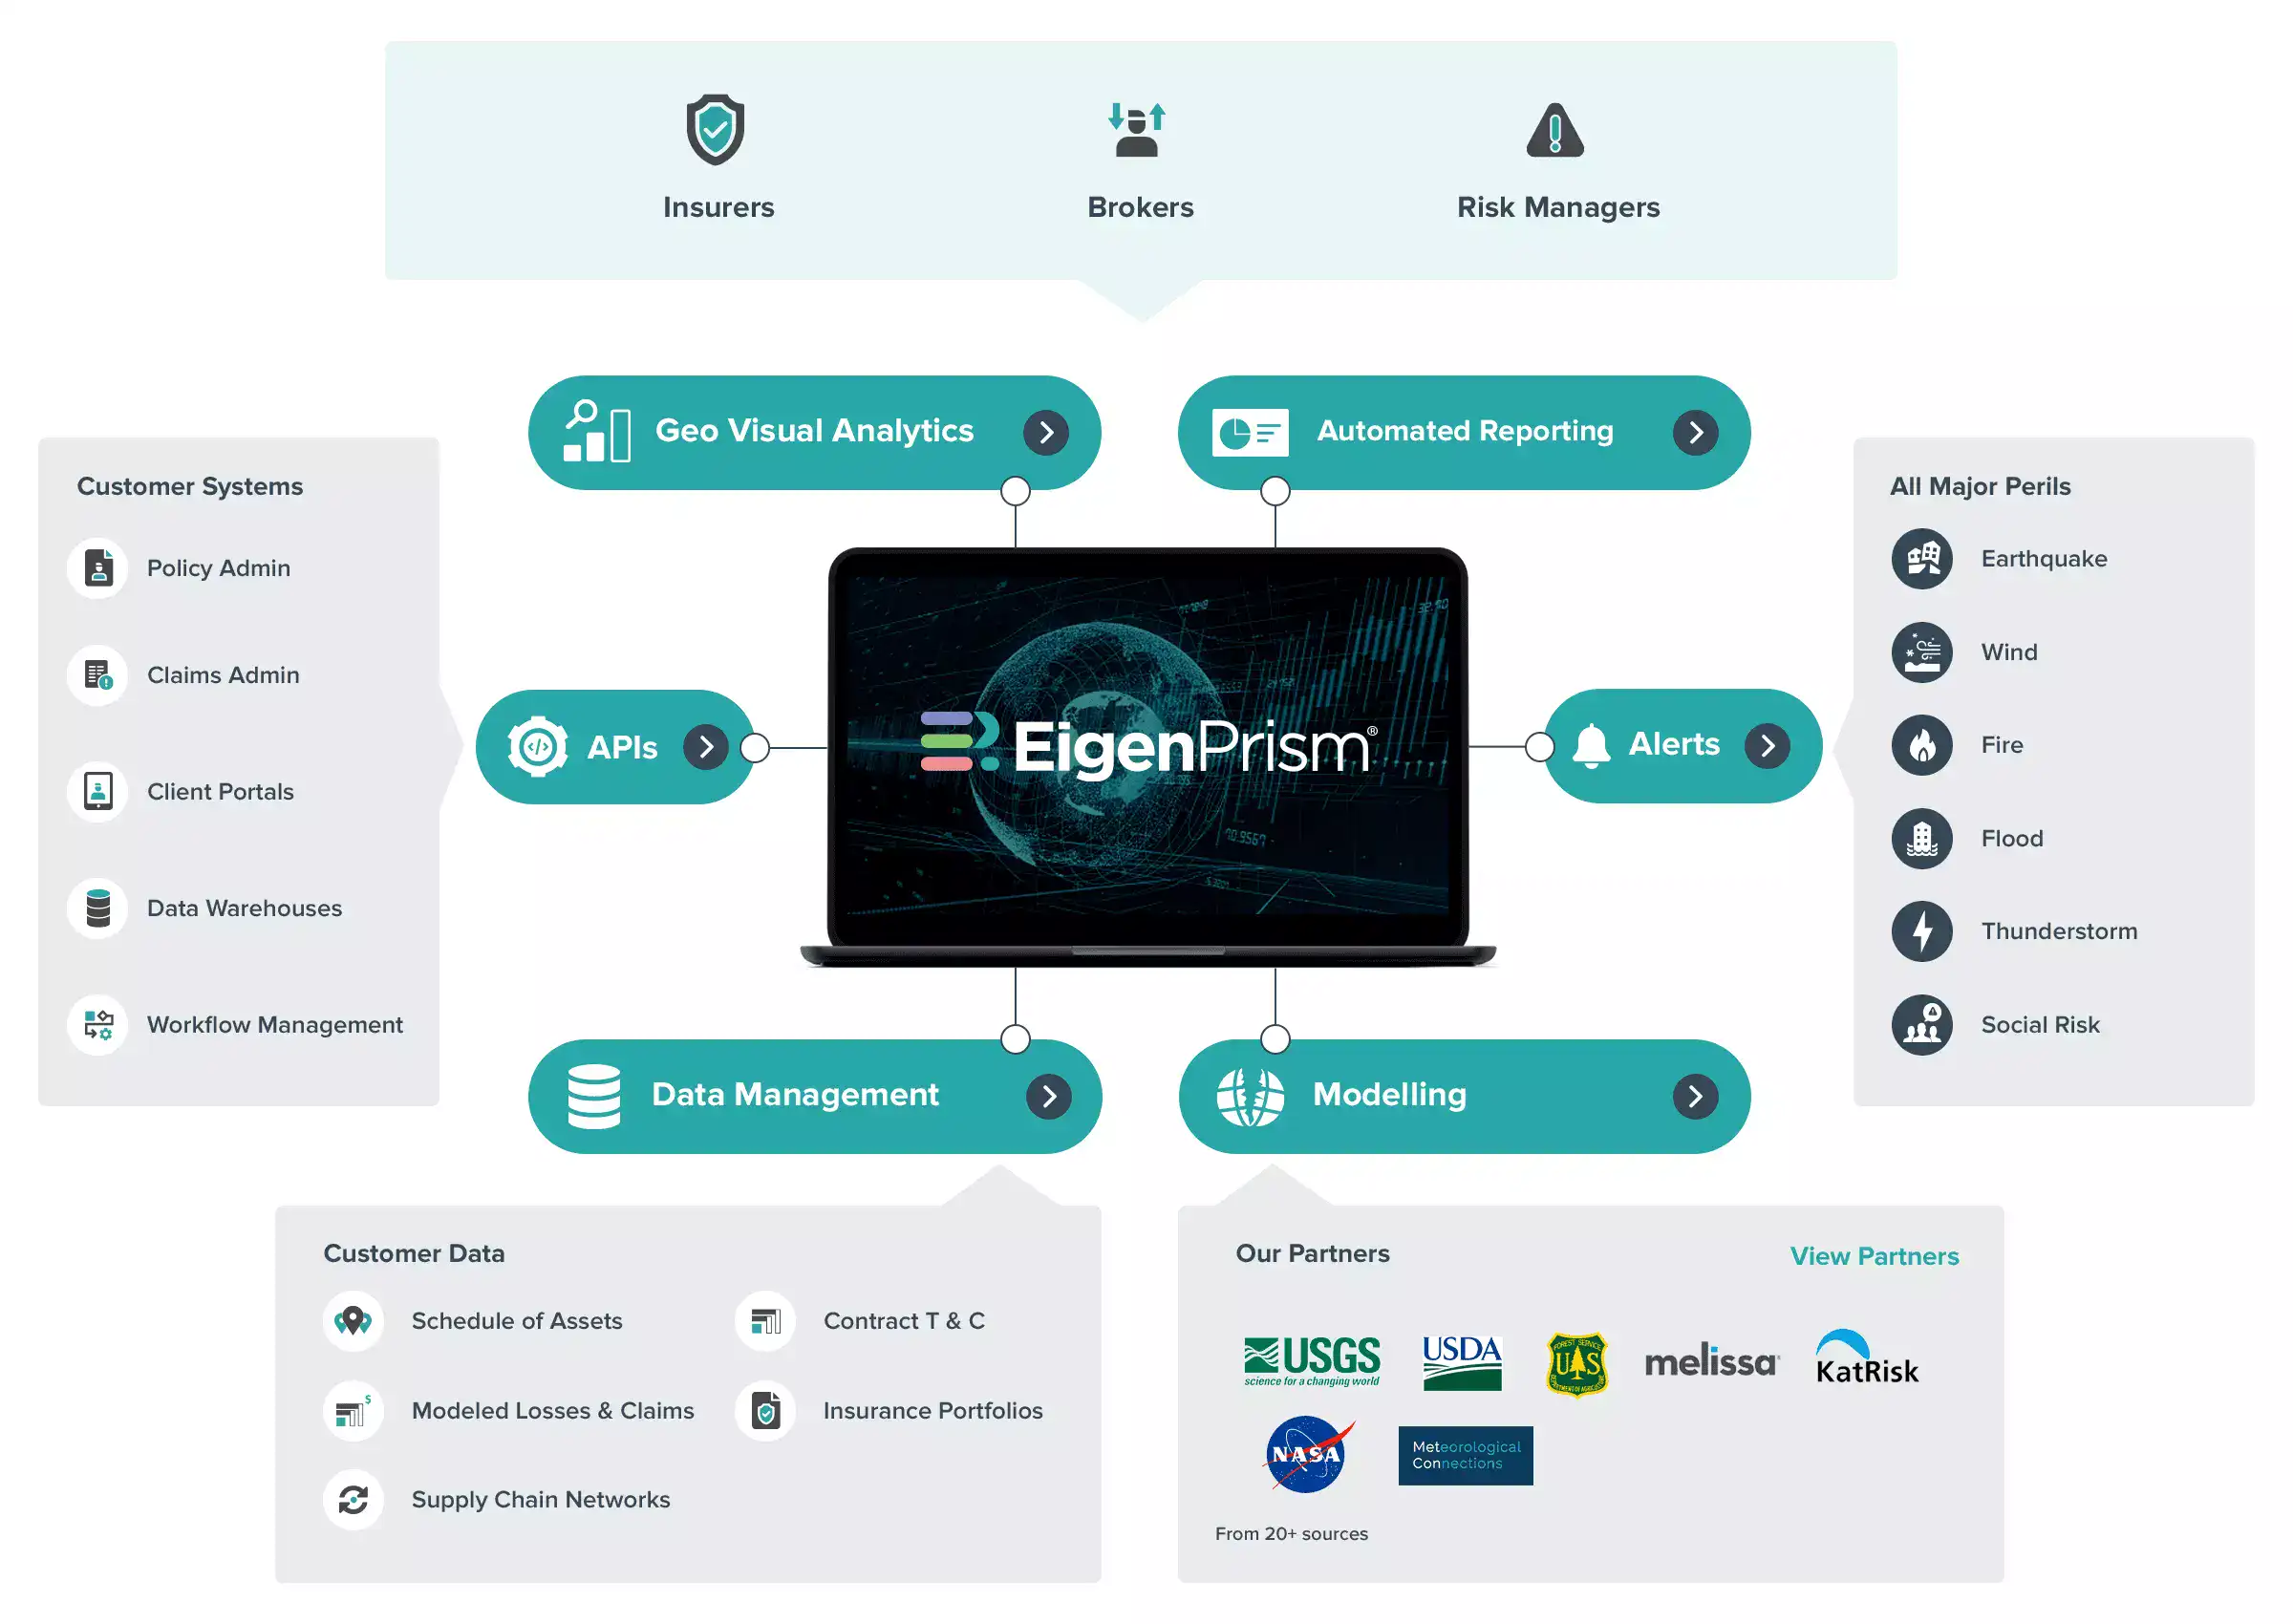
Finally, while the Fathom data layers are available within CatNet, users also have access to the standard CatNet flood data. So, in effect, they can get two views of risk in the EigenRisk platform, which can help in examining especially tricky areas.
Smith added that all the rich hazard layers, maps, models, and risk scores in the data that make up CatNet are now available and delivered through EigenRisk.
Badoni explained how risk and insurance professionals can use EigenRisk to assess their exposure in the context of TIV and determine the financial impact of an event.
He also noted that when you don’t have a model or trust the model that’s available you can still obtain a much better view of your accumulations. In these situations, users can get a realistic worst-case scenario to make timely and informed decisions.
Want to learn more?
To access the webinar, click here. To learn more about EigenRisk platform, please contact us: