The Event Response Gap: Why Traditional SCS Data isn’t Setting P&C Insurers Up for Success
May 16, 2025. 6:15 p.m. A tornado touches down in Marion, Illinois.
Your claims team needs an answer immediately: which policyholders are in the damage path, and how fast can you get adjusters there?
Here’s what data was available in that moment:
- A forecast polygon covering half the state
- Rotational tracks showing a general path – no ground-level detail
- SPC storm reports: scattered dots where someone called in an observation
The actual damage survey from NWS didn’t arrive for 37 hours.
By then, your response window was closed.
That gap between when the storm hits, and when the data is actually usable, is one of the most consequential operational problems in property insurance today. And for severe convective storm, it matters more than it does for any other peril.
Deepak Badoni, Co-Founder and President of EigenRisk recently hosted a webinar on this exact problem, and was joined by Andrew Siffert, Senior Vice President and Senior Meteorologist at BMS Group, and Don Giuliano, co-founder of Canopy Weather. What follows draws directly from that session. But, don’t skip out on watching the full recording to get the full picture.
The Rise of “Kitty CATS”: Why 30+ Events Per Year Is the New Normal
For years, SCS events were classified as a secondary peril – significant, but not the kind of thing that shaped reinsurance pricing or drove carrier strategy conversations. That framing no longer reflects the data.
Since 2015, severe thunderstorm events have generated over $360 billion in insured losses across roughly 500 events. Named storms – the traditional primary peril – account for about 35% of insurance industry events over that period. Thunderstorms account for 46%, and the gap is widening.
What has changed isn’t just the total. It’s the composition. Over the last five years, the industry has averaged more than 50 significant SCS events per year. The majority of them — more than 30 in a typical year – produce insured losses under $500 million each. Small enough to miss on a quarterly earnings call. Frequent enough to aggregate into annual losses approaching $50 billion, a figure that has held for three consecutive years.
Siffert calls these “kitty cats.” Not the major events that dominate headlines, but the steady accumulation of smaller storms that are quietly redefining what it means to manage cat exposure. In 2025, the Storm Prediction Center issued a severe weather outlook for all but 6% of the days in the calendar year. Between March and October, there was a forecasted severe weather day every single day.

For claims and cat teams built around the rhythm of discrete events, this pace doesn’t work. There is no off-season. There is no waiting for a named storm to justify standing up a response process. The operational question isn’t whether a significant SCS event will happen this week. It’s which of the 50-plus events this year will require your team to act, and how fast.
The $360 Billion Problem
Andrew Siffert, Senior Vice President and Senior Meteorologist at BMS Group, walks through the insured loss data behind severe convective storm’s rise, what the kitty cat distribution actually looks like, and why calling this a secondary peril is no longer defensible.
The Data Most Teams Use Was Built for a Different Problem
Understanding why the event response gap exists requires understanding what the standard data sources were actually designed to do.
SPC local storm reports are the most commonly used post-event data source in the industry. They were built to verify that a National Weather Service warning correctly anticipated severe weather. Their purpose is confirmation, not reconstruction. A report captures that someone observed hail at a specific point at a specific time. It says nothing about the spatial distribution of where damage actually occurred – which can extend for miles around any given observation.
That distinction, as Siffert notes, is one the industry has consistently glossed over. “Local storm reports aren’t meant to be used for event response,” he said during the session. “The true meaning of a local storm report is to verify a warning. It’s a completely different use case, and unfortunately, our industry is just infatuated with them.”
Giuliano uses an analogy that cuts straight to the problem. Think of radar data as a pixelated version of the Mona Lisa. You can see the broad shape of what happened – general location, general intensity but the resolution isn’t there. The fine details that would tell you which properties took damage are lost in the pixels. Storm reports, by contrast, are scattered dots. Each one is accurate at that specific point. But dots don’t tell you what happened across the space between them.
What insurers actually need is a high-resolution reconstruction of what occurred after the storm: where hail fell, at what size, across which footprint. That is a fundamentally different problem than what radar or storm reports were ever designed to solve.


The Mona Lisa Analogy
Don Giuliano, co-founder of Canopy Weather, walks through exactly why combining radar and storm reports still leaves insurers with an incomplete picture of what actually happened, and how Canopy’s approach to uncertainty reduction changes the equation.
What Closing the Gap Actually Looks Like
The alternative to this workflow isn’t theoretical. It’s operational, and the contrast with current practice is significant.
The traditional SCS event response process goes something like this: download storm report files, open QGIS, manually overlay your exposure data, export a list of potentially affected policies, pass it to adjusters, and start over for the next event. Multiply that process by 50-plus events a year, across a national portfolio, and you have teams spending more time managing data than interpreting it.
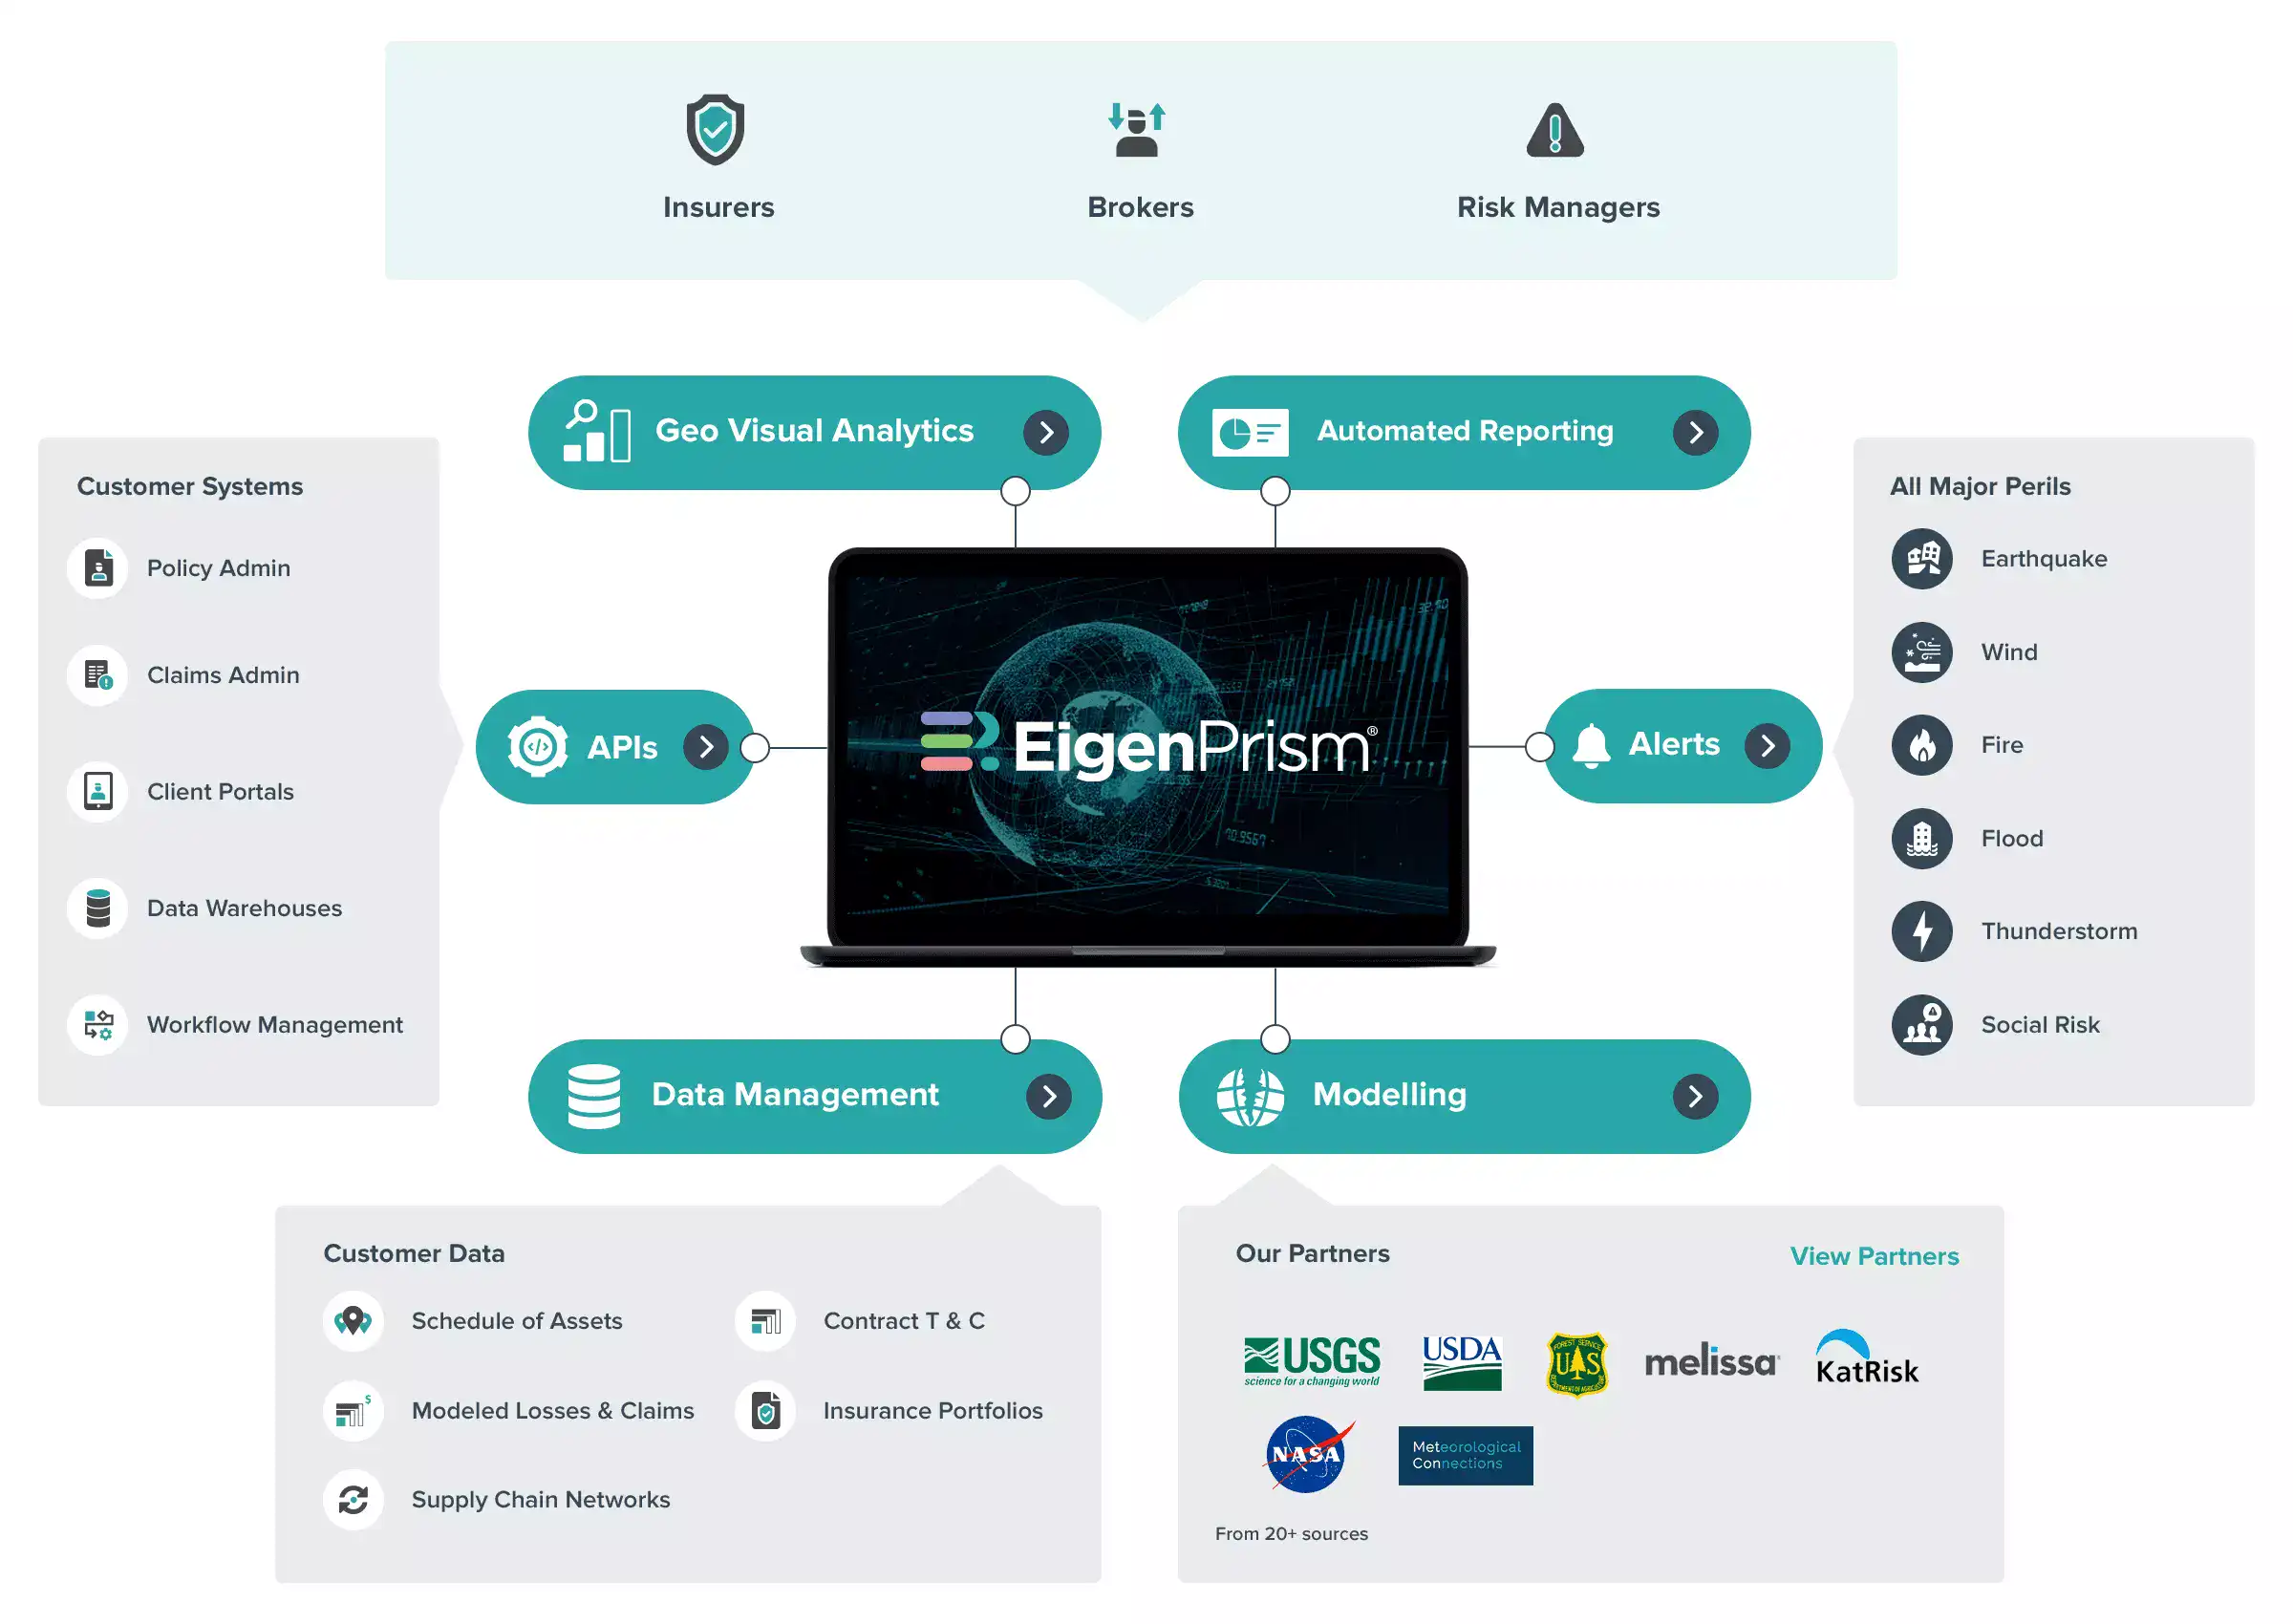
The shift that platforms like EigenPrism enable is not incremental. Canopy’s hail and tornado footprints are produced and refined within hours of an event concluding and ingested automatically so teams aren’t waiting on a data download to begin their analysis. The first usable picture of a hail swath or tornado path arrives before most teams would have finished pulling raw files. That initial estimate is refined as additional ground-level observations, quality-controlled inputs, and validated data come in, with most revisions complete within the first few hours after an event.
On the response side, the workflow change is equally significant. Rather than manually reviewing every event, teams configure alert thresholds that match their specific portfolio and risk appetite – hail intensity, peril type, exposed limits. A residential writer in a hail-prone state gets different alerts than a team writing large commercial excess layers. A near-miss notification – an event that passed within half a mile of an insured property – can trigger a what-if scenario analysis before a claim is ever filed.
Badoni ran a live poll during the session: only 25% of attendees said they receive event response data automatically. The other 75% are still running some version of the manual process. At 50-plus events per year, that moves from being an efficiency gap to being a compounding liability.
Before vs. Now — The Workflow Transformation
This is the before-and-after workflow in detail, including how alert thresholds work inside EigenPrism and why the platform is designed to reduce the anxiety that the news cycle induces.
When Data Becomes Your Competitive Advantage
There is a dimension of the event response gap that rarely surfaces in conversations about data quality, and it deserves to be said plainly.
The same data insurers use to identify where damage occurred is available to storm restoration contractors, public adjusters, and roofing companies and they have built sophisticated outreach operations around it. After a significant hail event, door-knocking starts fast. Often before a carrier’s claims team has a verified picture of the damage footprint, someone has already made first contact with the policyholder.
Speed of response is not only about operational efficiency. It is about who reaches the policyholder first after a loss event. When that first contact comes through a preferred contractor or a public adjuster rather than through the carrier, it shapes the entire claims process that follows – and frequently inflates it. Siffert made this point directly during the session: “You want your preferred vendor knocking on that door, not someone else. This time advantage could be quite important, and it’s not talked about enough.”
The event response gap, in other words, is not just a data problem. It is a competitive one.
Watch The Full Session
Check out the full recording to see multiple case studies with live platform demonstrations: the Greenfield, Iowa tornado, a multi-state hail event across the Mississippi and Ohio Valleys, the December 2021 Amazon distribution center strike that first put Canopy on BMS Group’s radar, and a recent tornado hit on one of the largest solar facilities in the Midwest. The Q&A session covers practical questions about alert configuration, data latency, and how different types of carriers and brokers are applying these tools to their current books.
If you are managing SCS exposure, overseeing adjuster deployment, or trying to understand why your post-event data keeps producing surprises, the session gives you a specific, operational answer to what’s actually available and when.