Extreme Winter Storm Threatens Half the U.S. With Damaging Ice, Heavy Snow, and Record Cold
A powerful and widespread winter storm, one of the most extreme in years, is set to impact more than two dozen states with damaging ice, heavy snow, and brutally cold Arctic air, stretching over 1,500 miles from the Plains through the South and into the Northeast.
The system is expected to produce major travel disruptions, widespread and potentially long-lasting power outages, and dangerous conditions as extreme cold accelerates snow and ice accumulation on roads and infrastructure.
Snow and ice are expected to begin in the Central and Southern Plains on Friday before expanding through Oklahoma, northern Texas, the Carolinas, Virginia, and Maryland by Saturday night, reaching the Northeast early Sunday and continuing into Monday.
The greatest icing threat and the highest risk of significant prolonged power outages, extends across northern and eastern Texas, the lower Mississippi and Tennessee valleys, northern Georgia, the Carolinas, and Virginia – affecting major cities including Atlanta, Dallas–Fort Worth, Charlotte, Huntsville, Little Rock, and Memphis.
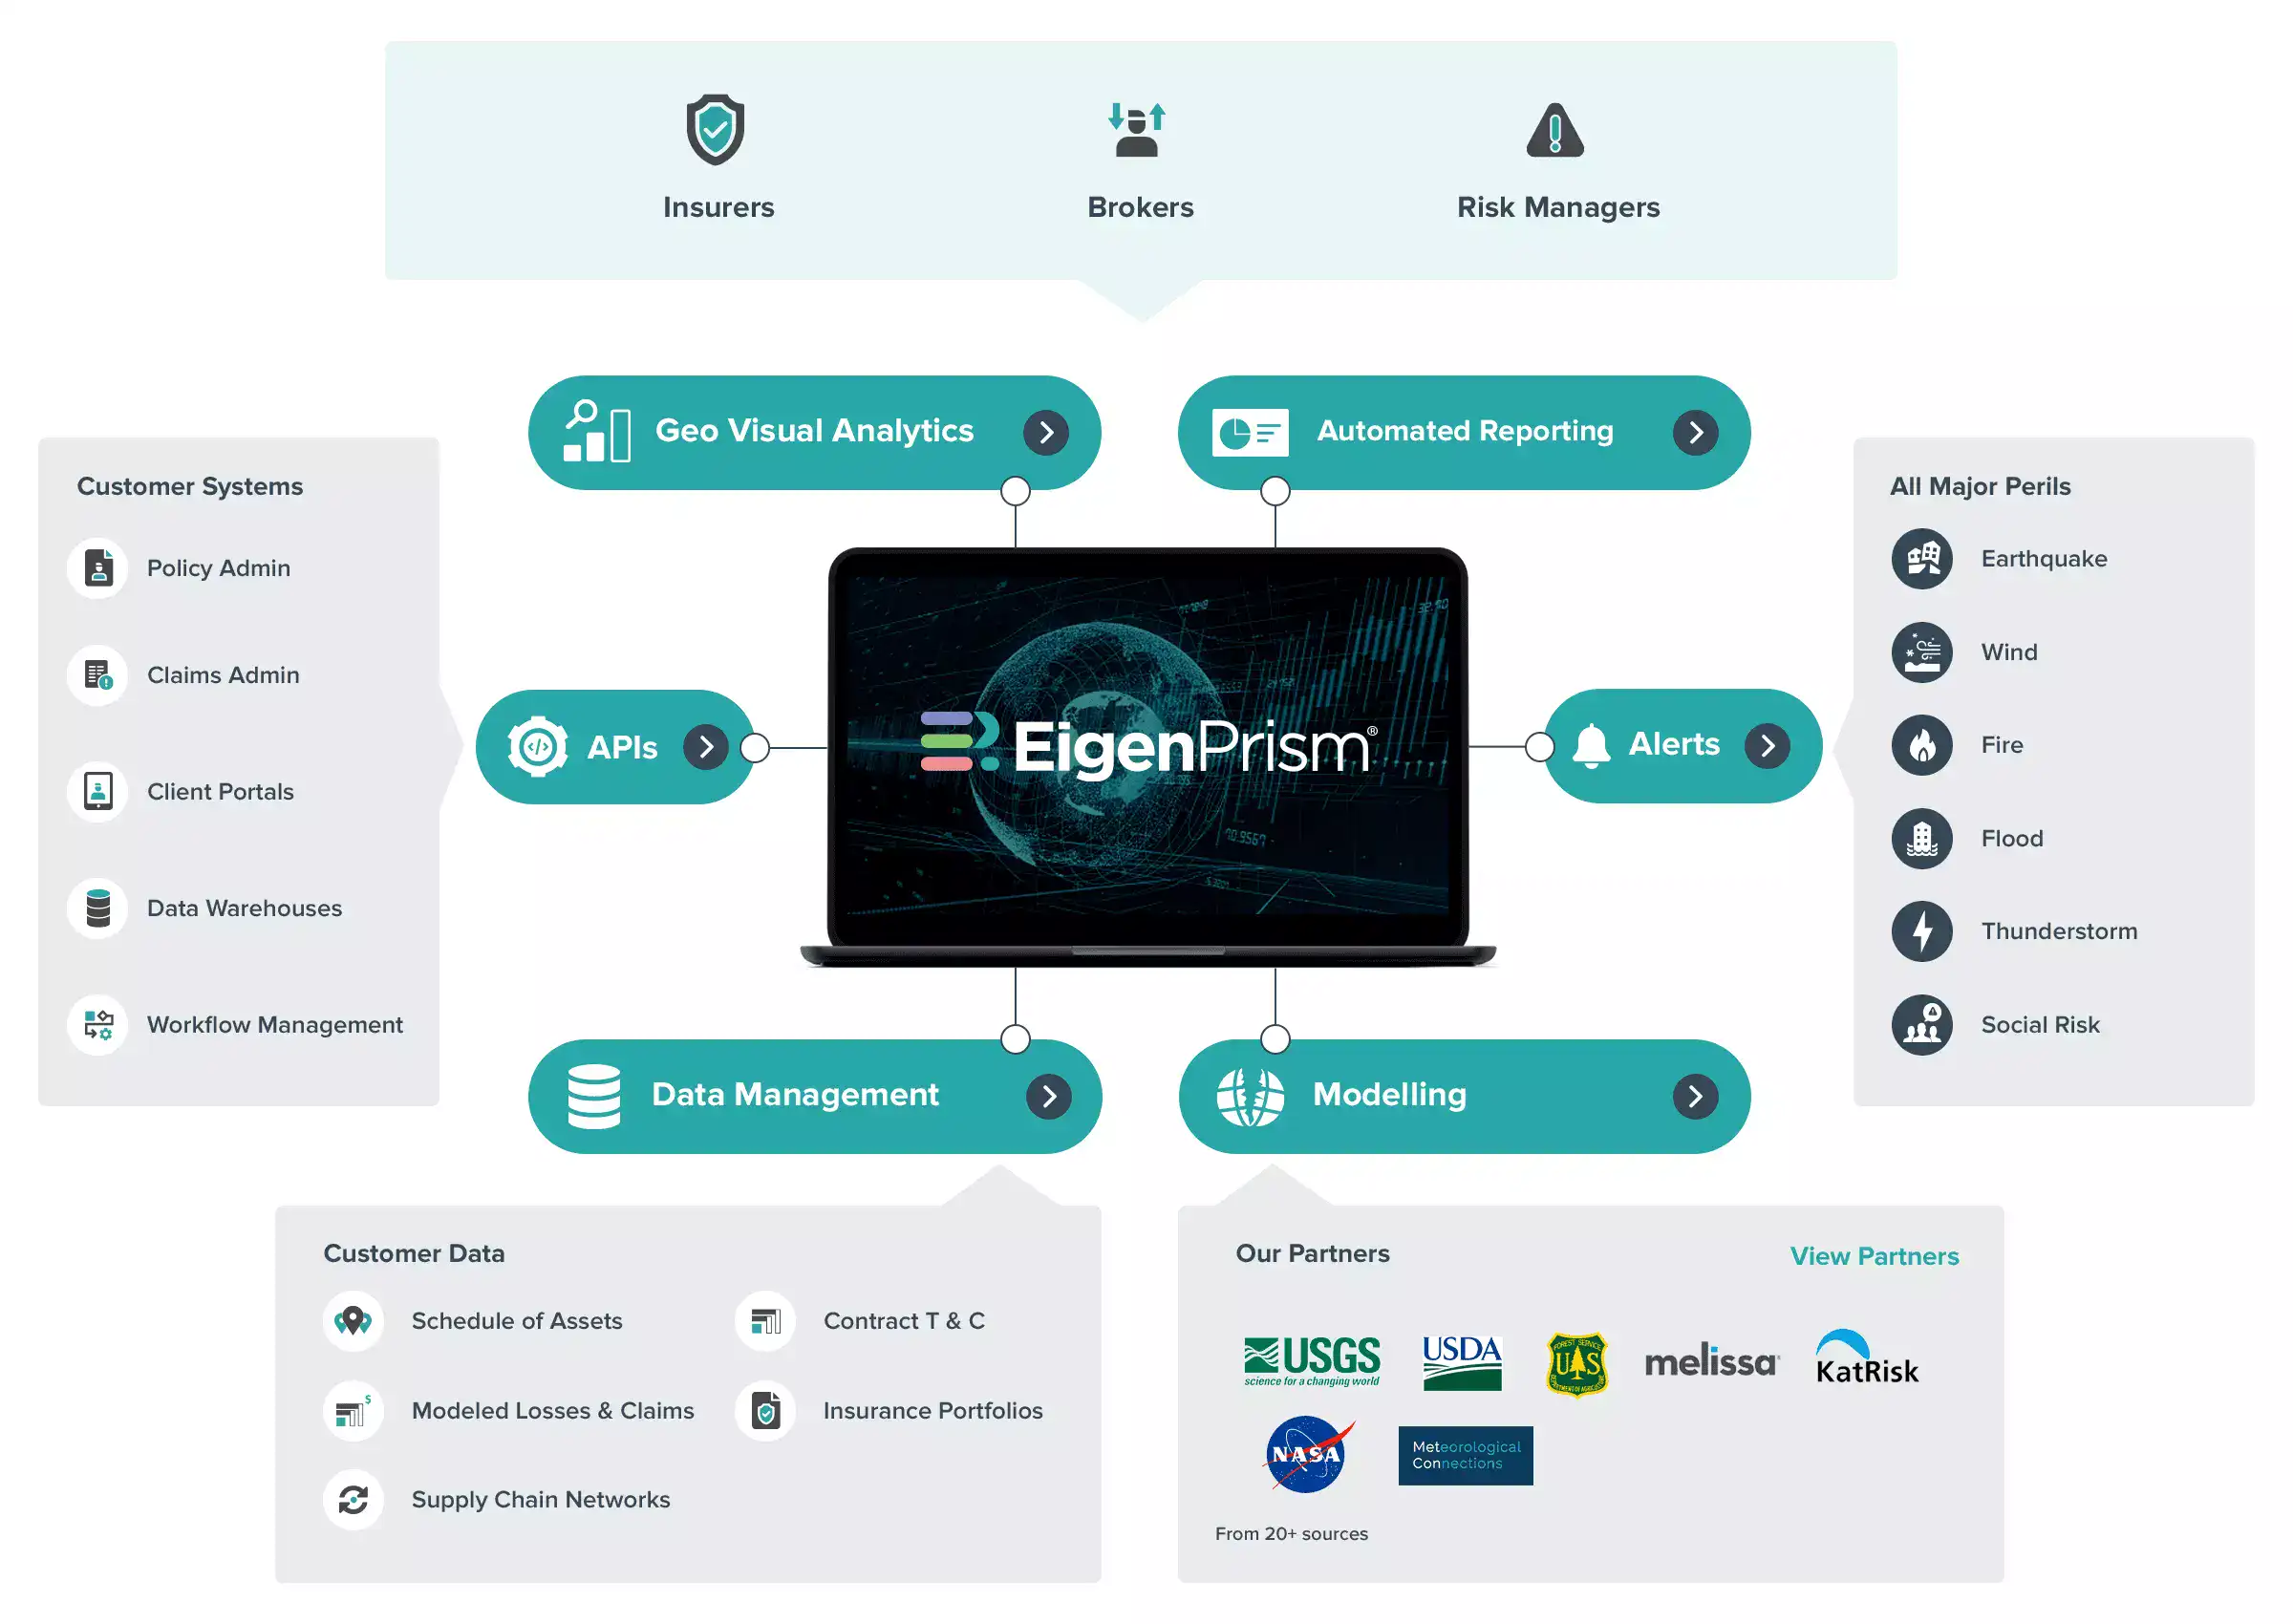
Actionable Analytics on EigenPrism
Forecast
Winter Storm Dataset
All EigenPrism® users can assess the forecasts associated with this event using the following report templates:
This report template enables you to assess the forecast of the winter storm based on footprints from NWS. The report consists of 72-hr Forecast Freezing Rain Accumulation, 72-hr Forecast Snow Accumulation, Potential Winter Storm Overall Impact and 6-day outlook of the pipe-freeze risk for CONUS by Adiabat. The pages auto-update with the latest available data.
This report template enables you to assess the summary level forecast (Potential Overall Winter Storm Impact) and four component WSSI (Winter Storm Severity Index) footprints from NWS. The four component WSSI footprints consist of Potential Snow Amount Impact, Snow Load Impact, Ice Accumulation Impact, Blowing Snow Impact. The report template pages auto-update with the latest available data.
Adiabat’s Pipe-Freeze Dataset
All EigenPrism® users can assess the 6-day outlook of the pipe-freeze risk for this severe weather event using the following footprint:
For more information on this, register here to view our latest webinar on – Adiabat’s Pipe-Freeze Risk and Six Warning Signs that Every Insurer Must Watch this Winter
Alerts
Users who have alerts set on their exposures for the relevant event sets (severe weather and winter storm) like those from NWS and Adiabat will receive alerts (if the event footprints impact these exposures).
To learn more about how to set an alert on a specific event set, check out this help center article.
Feel free to contact us at Prism.Support@eigenrisk.com or reach out directly to your Customer Success Manager with any questions or concerns. Our team is here to assist you with setting alerts, understanding report templates, and maximizing the actionable insights available through EigenPrism®.
Not an EigenPrism User? Here’s a Quick Way to Check ZIP-Level Impact
For underwriters, brokers, and portfolio managers who need fast visibility into impacted ZIP codes, we’ve built a tool called ZIP Response on our website. It’s a free, no-login tool that highlights the top ZIP codes that are most impacted during active events, such as hurricanes, floods, wildfires, and severe storms.
You can request the complete ZIP list by simply filling out a short form and get it delivered straight to your inbox.
If you’d like to explore the impacted ZIP codes for this event, visit ZIP Response.
Or Contact us, to have more info on this.
Download the EigenAlert Mobile App Today!
With the EigenAlert mobile app, monitor alerts and impacted assets without being tied to your desk.

How to Get Started:
- Scan the QR code using your phone to download the app.
- Log in with your existing EigenPrism credentials.
- Begin accessing your alerts instantly.