Northern and Southern California Face Elevated Flood Risk as Heavy Rain Continues
Heavy rainfall and strong winds over the weekend triggered widespread flooding across parts of Northern California, disrupting major transportation routes and elevating flash flood risks. The flooding is being driven by a series of repeated atmospheric river systems impacting the West Coast, delivering heavy rain, snow, and gusty winds to an already saturated region. As a result, flood watches are now in effect for more than 30 million people across California, with additional heavy rainfall expected in the coming days.
On Sunday, multiple cities across Northern California reported submerged roadways, leaving vehicles stranded and prompting emergency response efforts. A Flood Watch was issued for large portions of the region, including Redding and Sacramento, where some locations are forecast to receive 4 to over 6 inches of rain.
In Redding near Buenaventura Boulevard, floodwaters reached knee height by Sunday afternoon, while power outages were reported in several affected communities. Farther south, concerns are increasing as heavy rainfall shifts into Southern California, raising the risk of flash flooding, mudslides, and debris flows, particularly in areas with steep terrain and recent burn scars.
Actionable Analytics on EigenPrism
Forecast
Flood Dataset
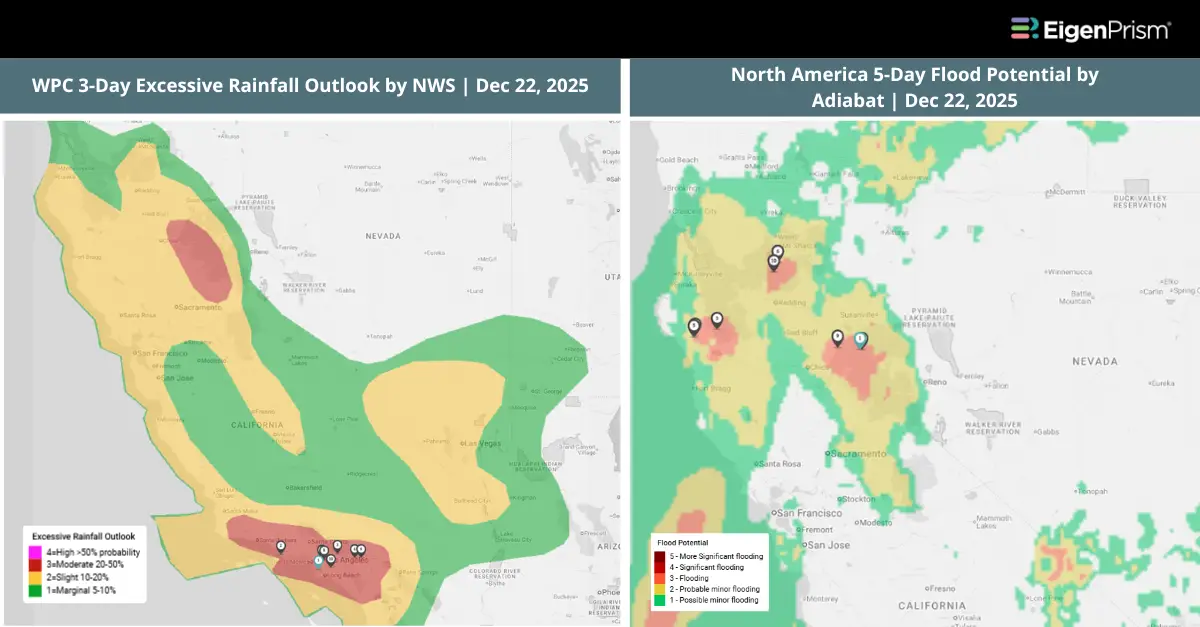
All EigenPrism® users can assess the forecast of the flood using the following report template:
This report template consists of the following flood footprints: WPC 3-Day Excessive Rainfall Outlook & US Flood outlook by NWS and 3-day & 5-day flood potential from Adiabat. The pages auto-update with the latest available data.
Winter Storm Dataset
All EigenPrism® users can assess the forecasts associated with this event using the following report templates:
This report template enables you to assess the forecast of the winter storm based on footprints from the NWS. The report consists of 72-hr Forecast Freezing Rain Accumulation, 72-hr Forecast Snow Accumulation, and Potential Winter Storm Overall Impact. The pages auto-update with the latest available data.
Alerts
Users who have alerts set on their exposures for the relevant event sets, like those from NWS and Adiabat, will receive alerts (if the event footprints impact these exposures).
To learn more about how to set an alert on a specific event set, check out this help center article.
Feel free to contact us at Prism.Support@eigenrisk.com or reach out directly to your Customer Success Manager with any questions or concerns. Our team is here to assist you with setting alerts, understanding report templates, and maximizing the actionable insights available through EigenPrism®.
Not an EigenPrism User? Here’s a Quick Way to Check ZIP-Level Impact
For underwriters, brokers, and portfolio managers who need fast visibility into impacted ZIP codes, we’ve built a tool called ZIP Response on our website. It’s a free, no-login tool that highlights the top ZIP codes that are most impacted during active events, such as hurricanes, floods, wildfires, and severe storms.
You can request the complete ZIP list by simply filling out a short form and get it delivered straight to your inbox.
If you’d like to explore the impacted ZIP codes for this event, visit ZIP Response.
Or Contact us, to have more info on this.
Download the EigenAlert Mobile App Today!
With the EigenAlert mobile app, monitor alerts and impacted assets without being tied to your desk.

How to Get Started:
- Scan the QR code using your phone to download the app.
- Log in with your existing EigenPrism credentials.
- Begin accessing your alerts instantly.