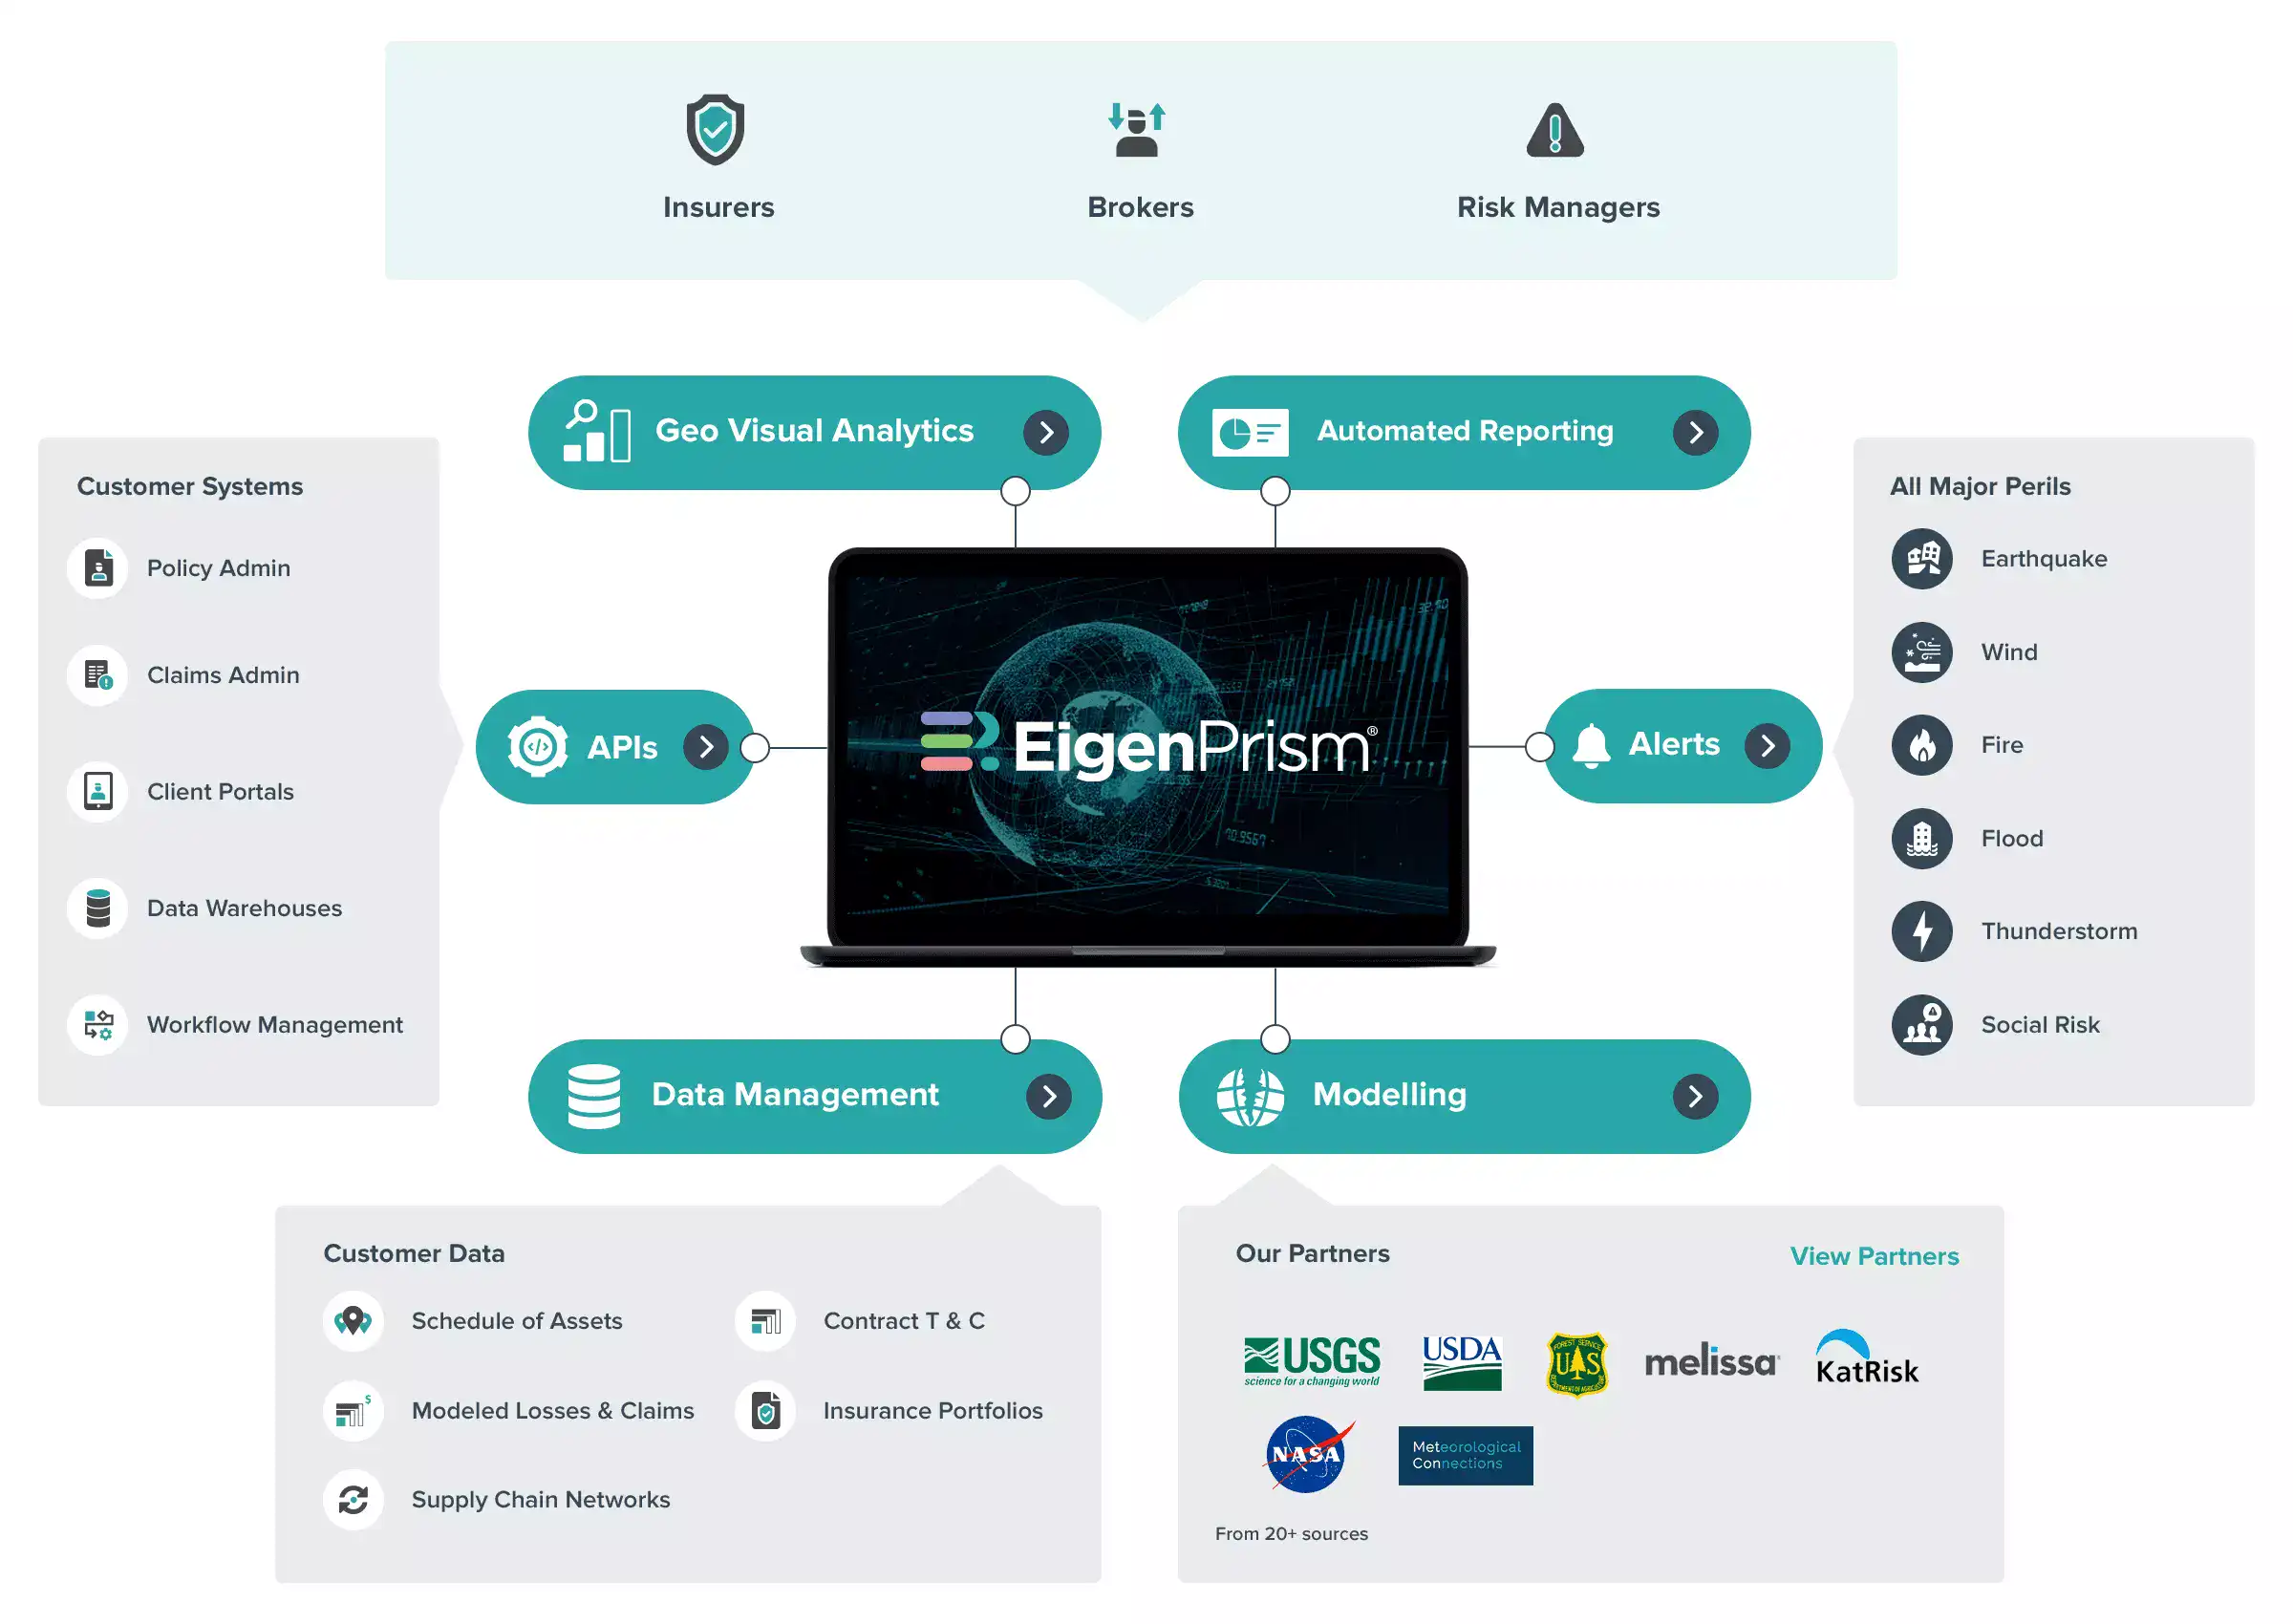



Actionable analytics for catastrophe risk management
As climate change, data quality challenges, and time-consuming workflows overwhelm traditional catastrophe risk modeling, EigenPrism integrates innovative analytics at the point of decision-making, across your key business operations




Integrate actionable catastrophe risk analytics into your key business functions.
Managing global catastrophe risks has become increasingly difficult due to climate change, data quality issues, and manually intensive analytics. Traditional tools are inadequate, slowing decision-making. With EigenPrism, you can eliminate the inefficiencies of outdated models and be prepared to navigate the increasing impact of climate events, ensuring smoother operation and sustained growth.
Exposure Management
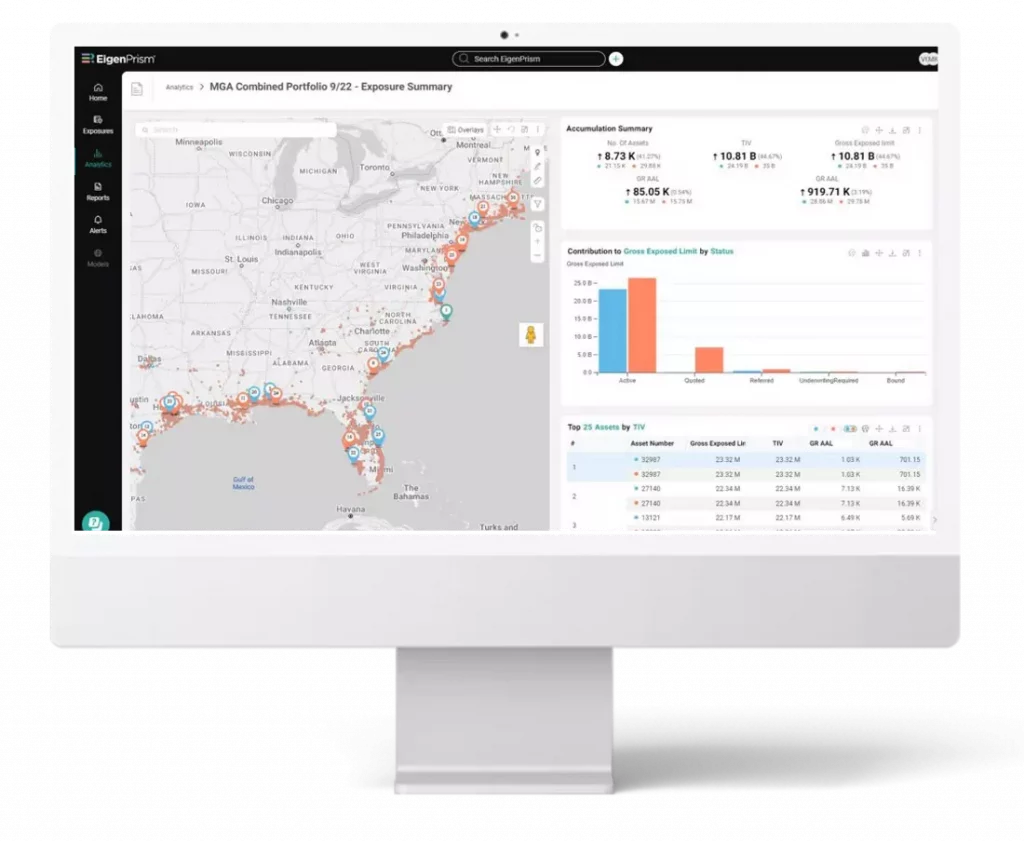
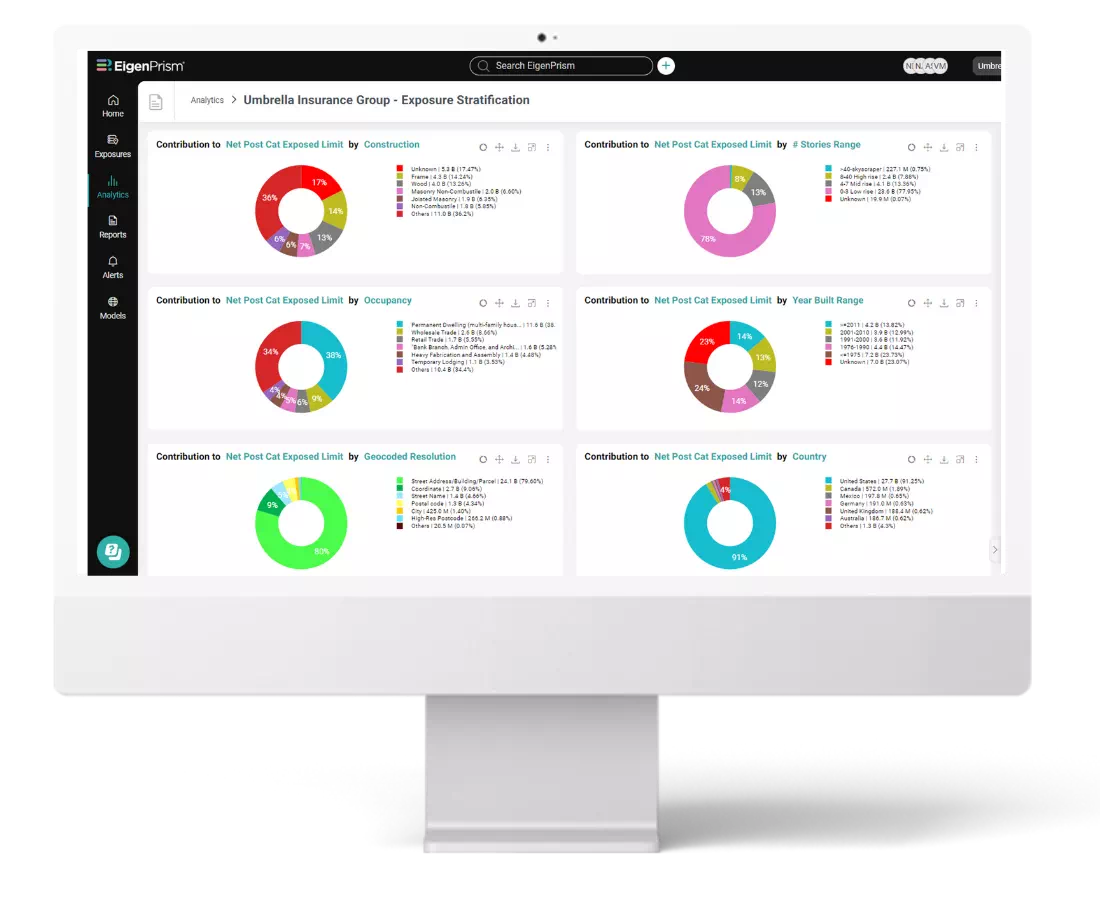
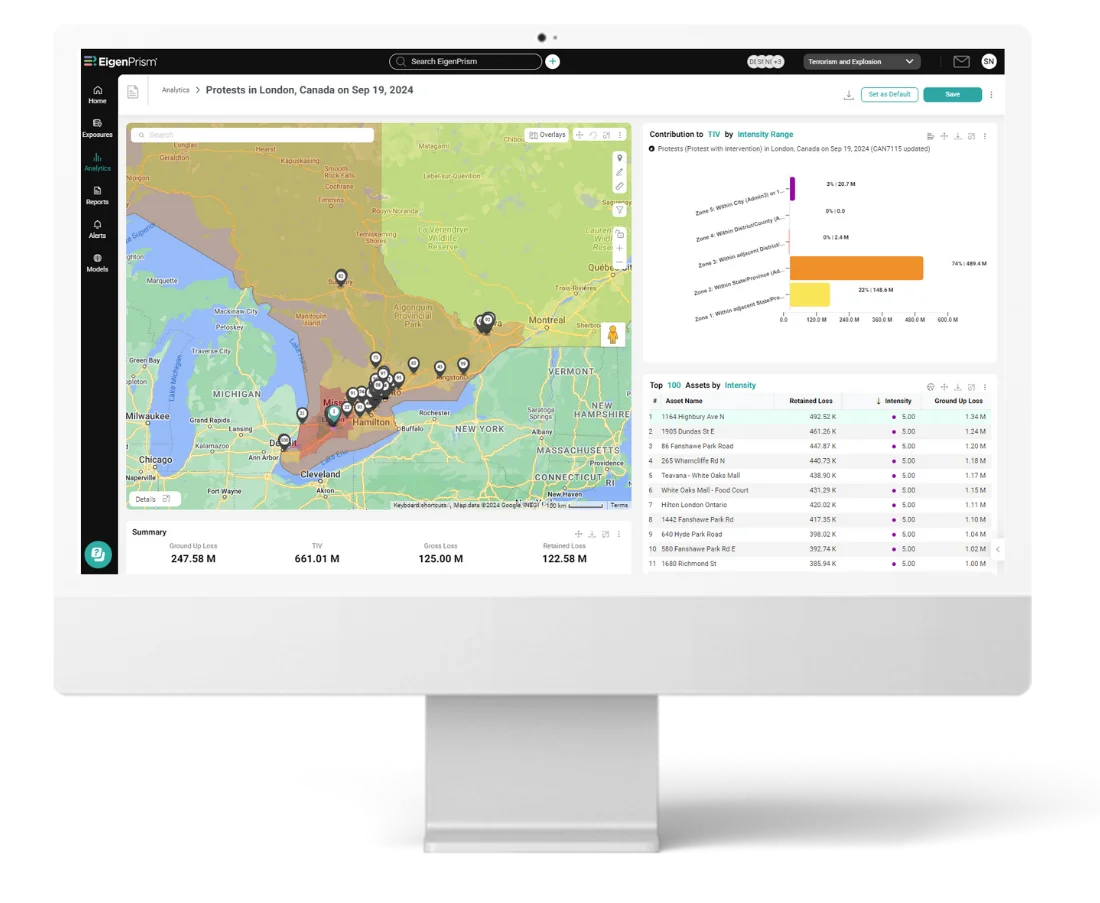
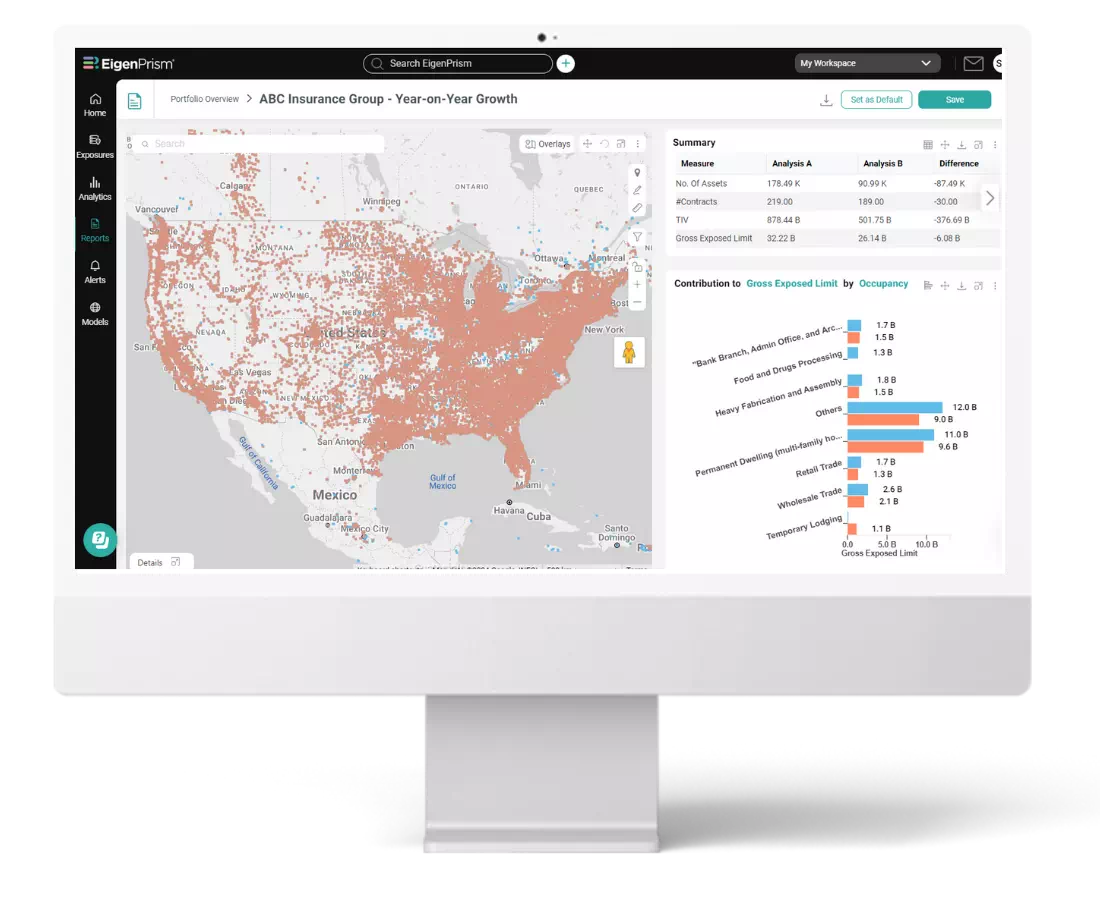
Ingest data from multiple formats, automate data refresh with our APIs, and also identify risk drivers in your portfolio using our interactive visualizations. Our embedded financial modeling engine even calculates the impact of complex policy, fac and treaty terms, so not just dummy data uploads.
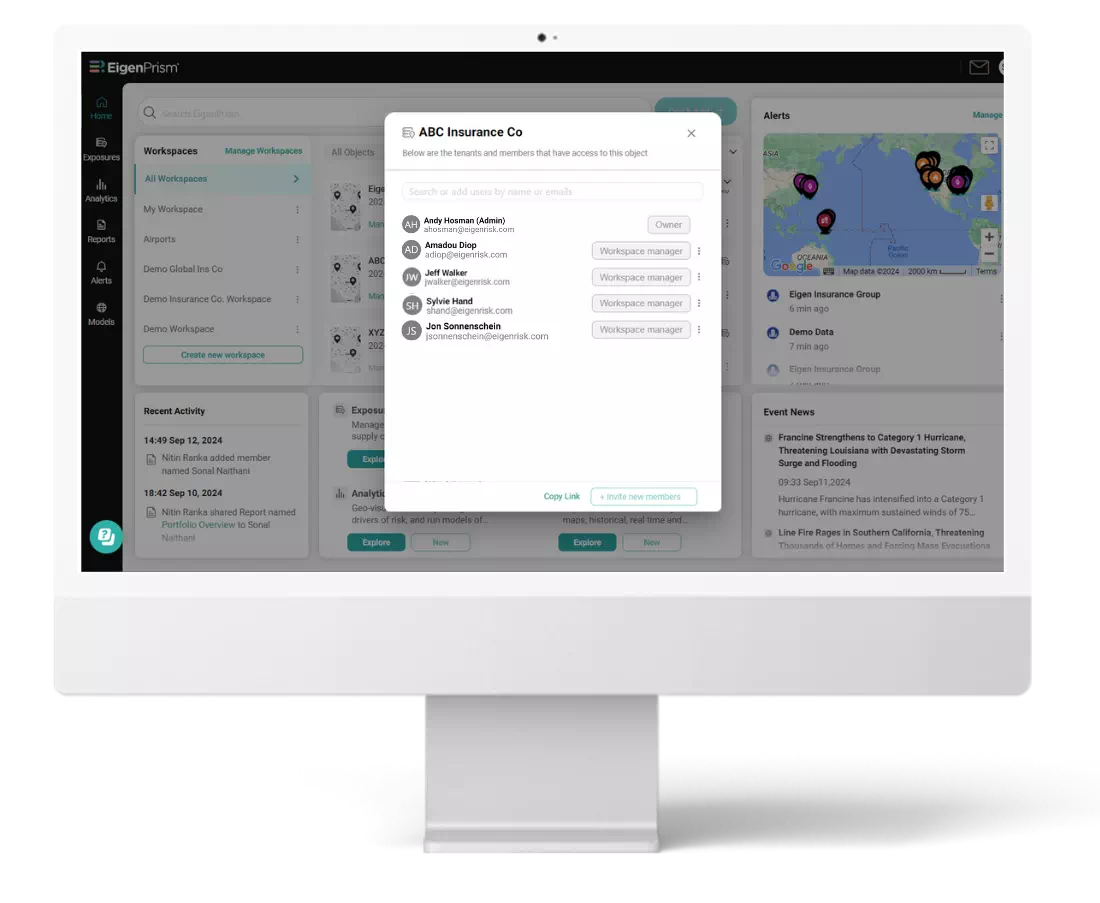
Your data can be organized into workspaces with different levels of access to different users within the same workspace. Think of these workspaces as shared folders that you selectively share.
Exposure data confined to spreadsheets and modeling databases can be fraught with errors and omissions. These issues are much easier to surface when you can interact with your data in an interactive geo-visual setting, especially when combined with the ability to generate pre-configured reports with a few clicks.
Avoid errors in data analysis stemming from data quality issues in the exposure data by geo-visual vetting of the data and generating summary reports for quick quality evaluation.
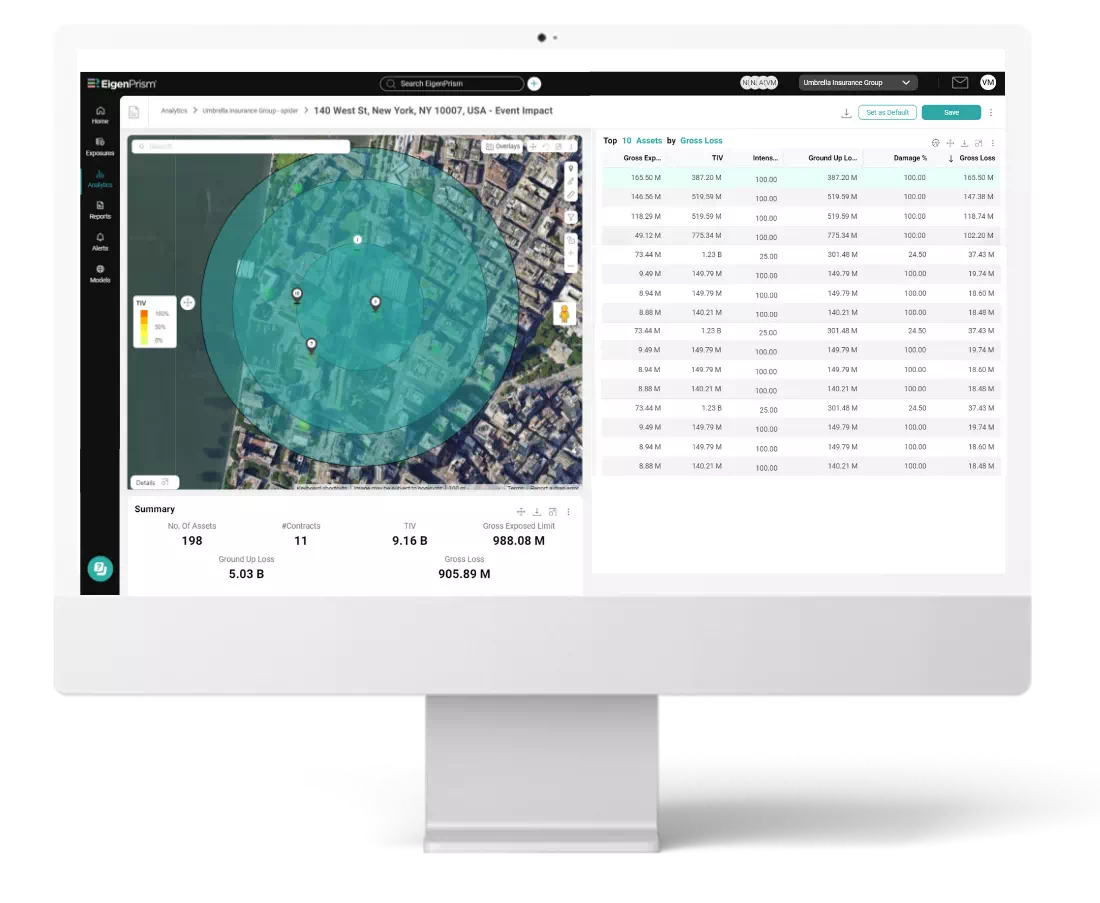
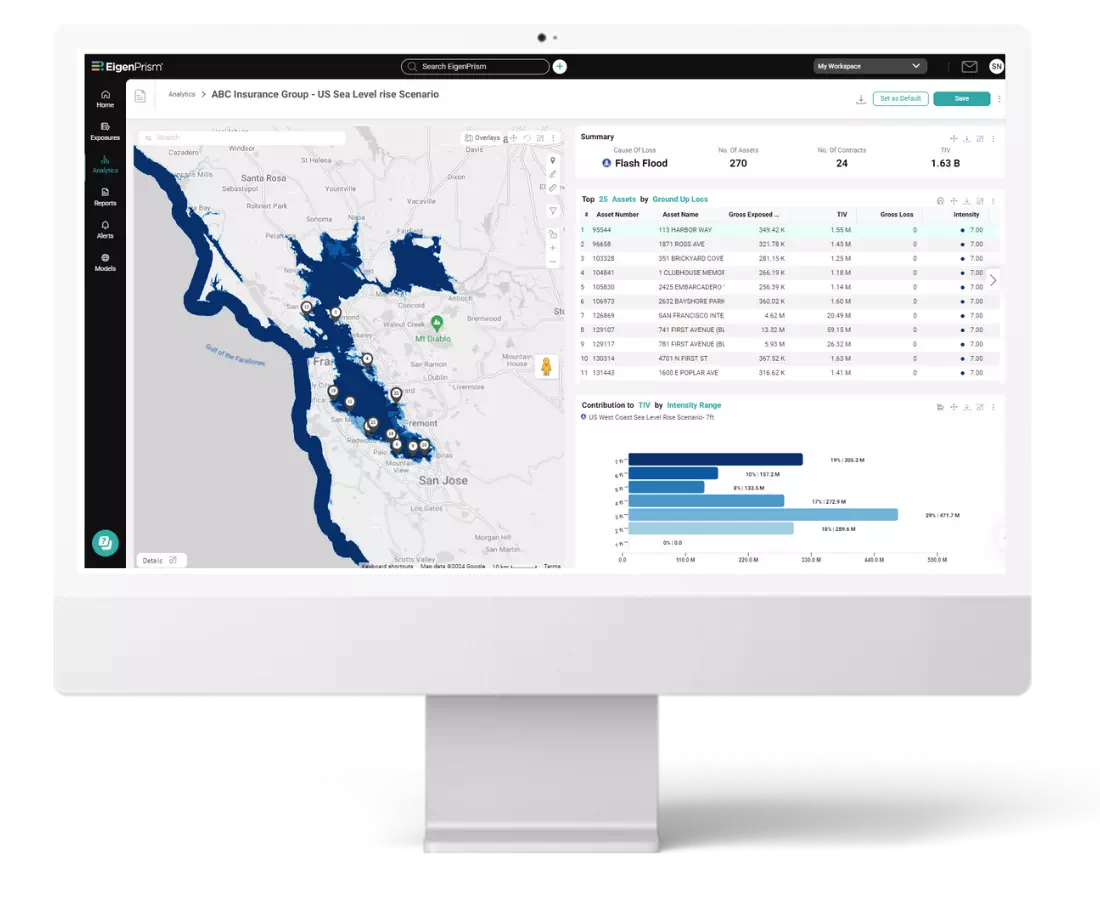
Using custom hazard maps, bespoke scenario models, and modeling assumption, import your data and run advanced analytics to manage insured risks anywhere you would like.
Exposure Management
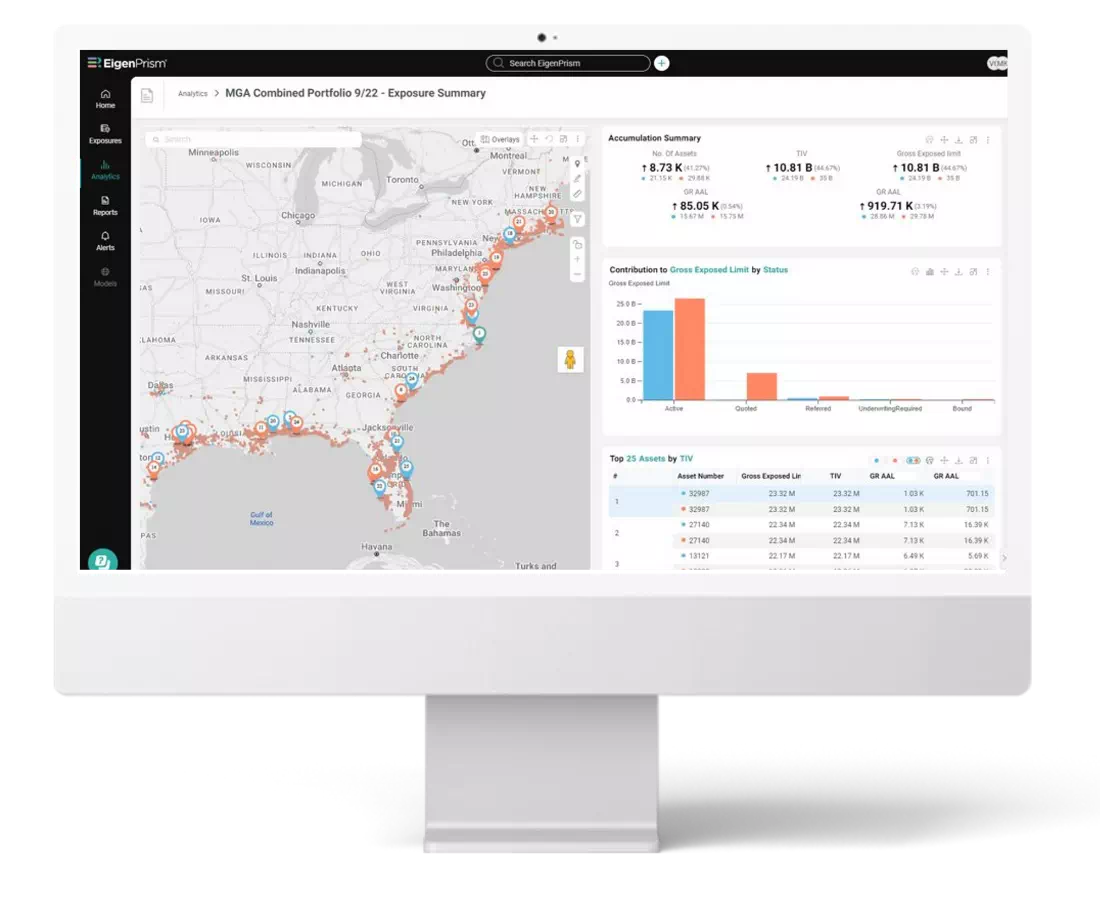
Ingest data from multiple formats, automate data refresh with our APIs, and also identify risk drivers in your portfolio using our interactive visualizations. Our embedded financial modeling engine even calculates the impact of complex policy, fac and treaty terms, so not just dummy data uploads.
Your data can be organized into workspaces with different levels of access to different users within the same workspace. Think of these workspaces as shared folders that you selectively share.
Exposure data confined to spreadsheets and modeling databases can be fraught with errors and omissions. These issues are much easier to surface when you can interact with your data in an interactive geo-visual setting, especially when combined with the ability to generate pre-configured reports with a few clicks.
Avoid errors in data analysis stemming from data quality issues in the exposure data by geo-visual vetting of the data and generating summary reports for quick quality evaluation.
Using custom hazard maps, bespoke scenario models, and modeling assumption, import your data and run advanced analytics to manage insured risks anywhere you would like.
Event Response
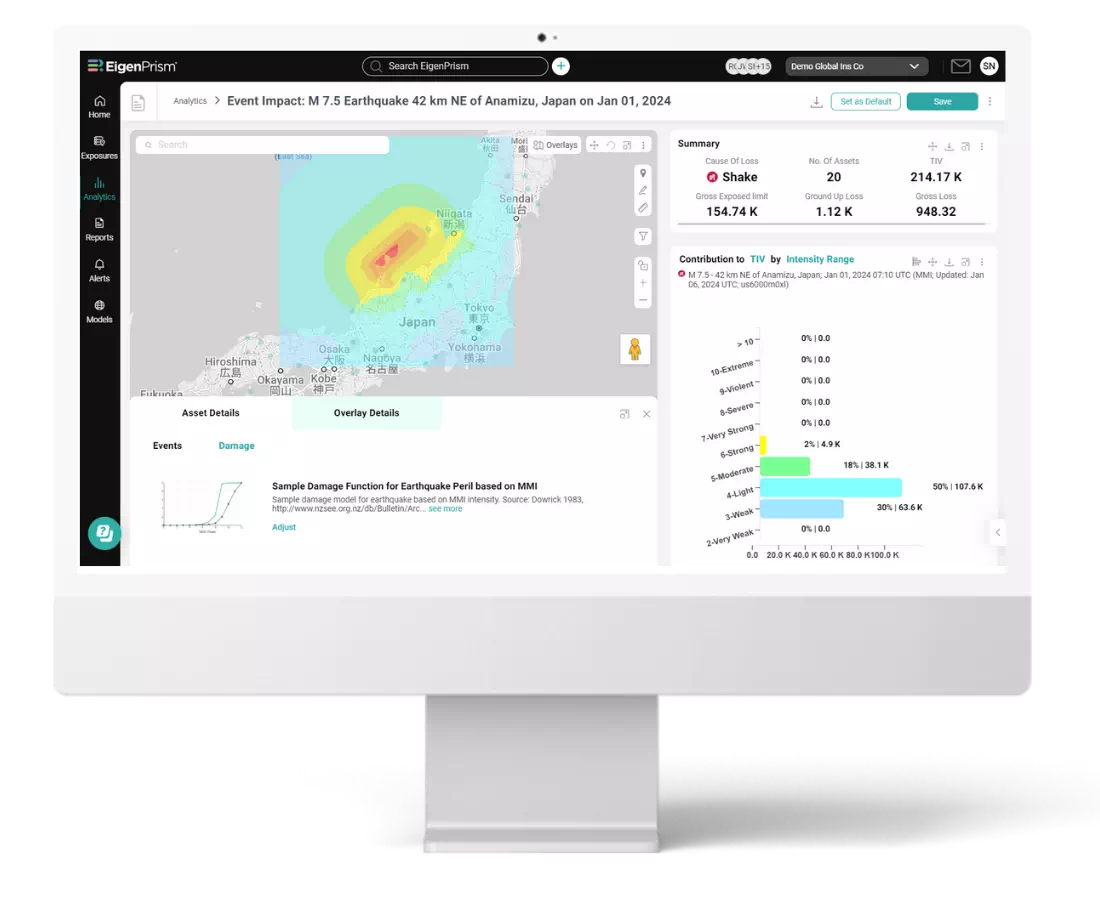
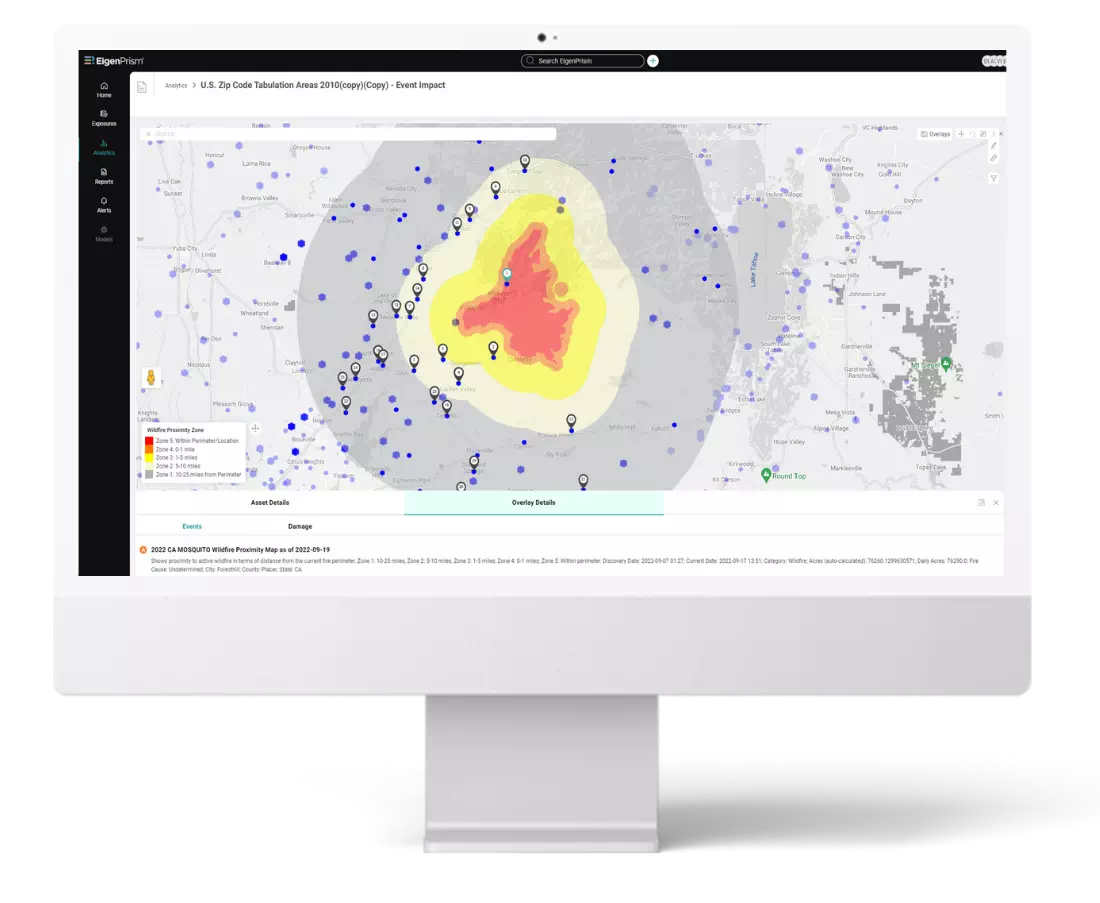
Stay abreast with our near real-time alerts as the catastrophe unfolds. Customized alerts are triggered when certain impact thresholds are breached. Set alerts to tune out the noise of the relentless news-cycle and switch to timely, actionable analytics focused specifically on your portfolio.
Access high resolution datasets from best-in-class specialists from our library of event forecasts and post-event footprints. Curated from public and private providers across perils and regions, use these multiple perspective for more confident estimations.
Spend time analyzing and not moving data around while monitoring an event. Adjust damage assumptions to get high quality estimates of the financial impact on your portfolio for reserving or reporting and better handle IBNR losses too.
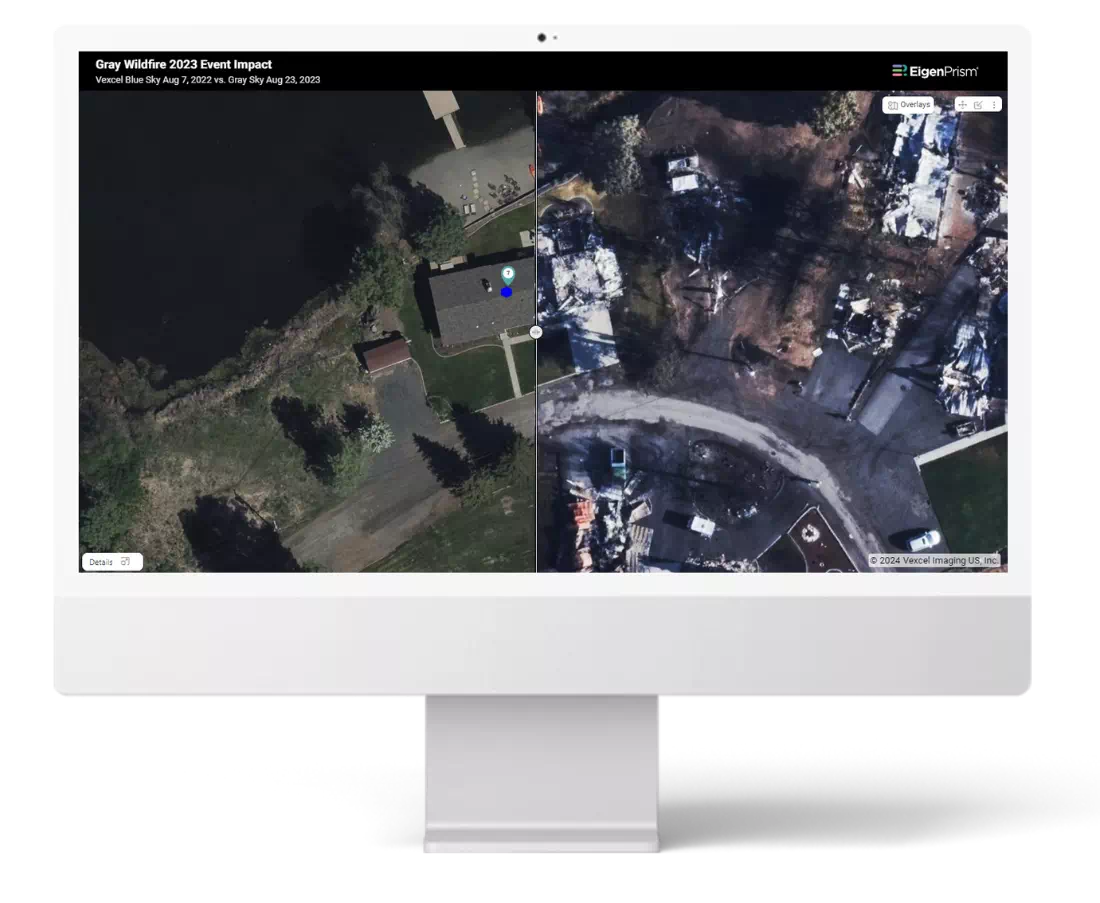
Utilize our location level analytics to proactively engage policyholders and reduce loss adjustment expenses with better triaging and resource allocation. Geo-visualize your claims to identify trends and anomalies.

Event Response
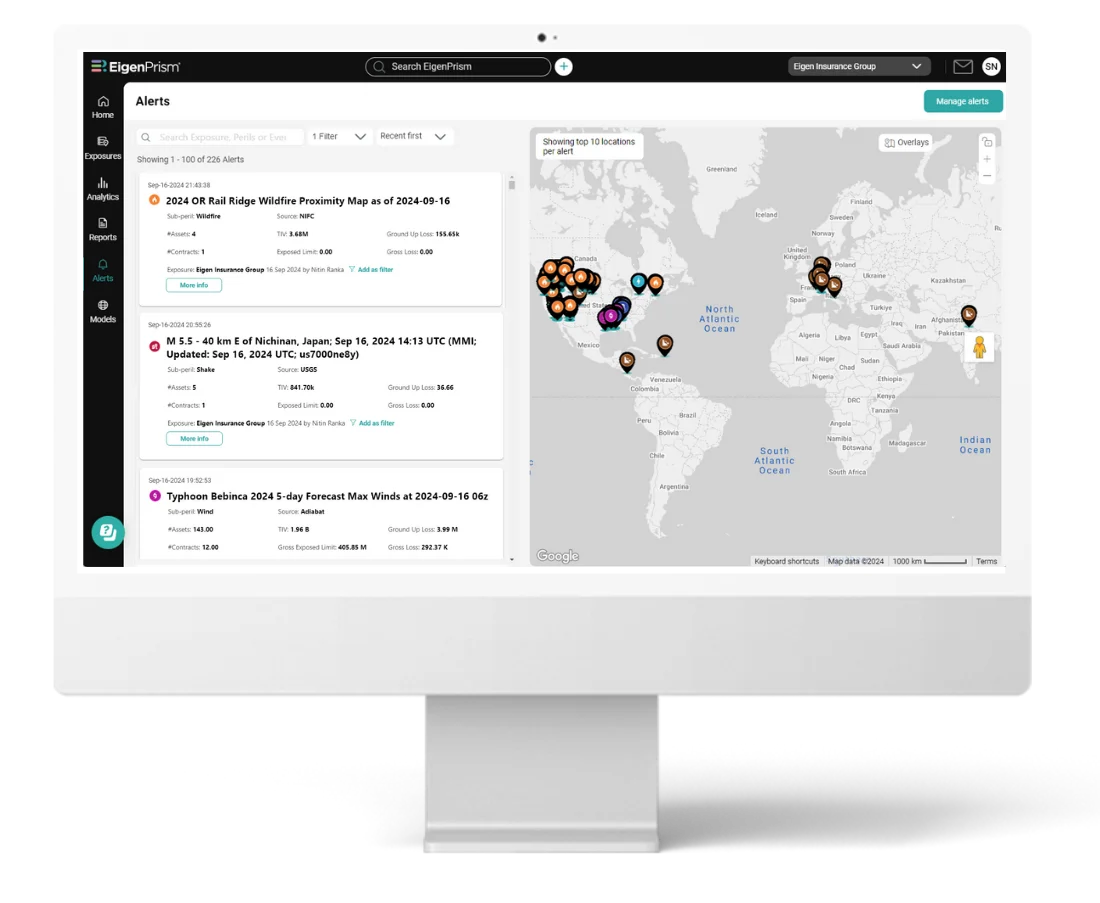
Stay abreast with our near real-time alerts as the catastrophe unfolds. Customized alerts are triggered when certain impact thresholds are breached. Set alerts to tune out the noise of the relentless news-cycle and switch to timely, actionable analytics focused specifically on your portfolio.
Access high resolution datasets from best-in-class specialists from our library of event forecasts and post-event footprints. Curated from public and private providers across perils and regions, use these multiple perspective for more confident estimations.
Spend time analyzing and not moving data around while monitoring an event. Adjust damage assumptions to get high quality estimates of the financial impact on your portfolio for reserving or reporting and better handle IBNR losses too.
Utilize our location level analytics to proactively engage policyholders and reduce loss adjustment expenses with better triaging and resource allocation. Geo-visualize your claims to identify trends and anomalies.
Underwriting
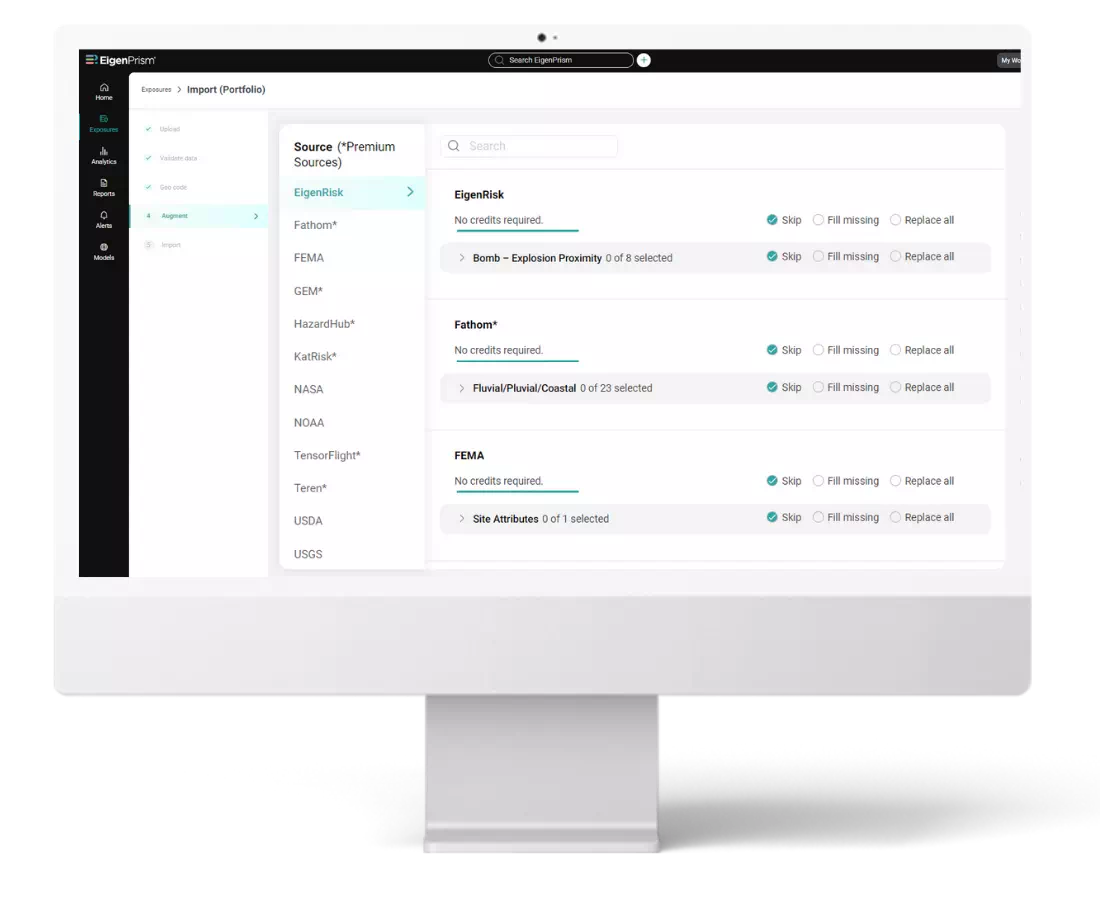
Bring SoVs to life by augmenting 1,000+ data fields from multiple sources for a more detailed view. Use pre-configured report templates to generate powerful exposure profiles that uncover data quality and completeness issues.
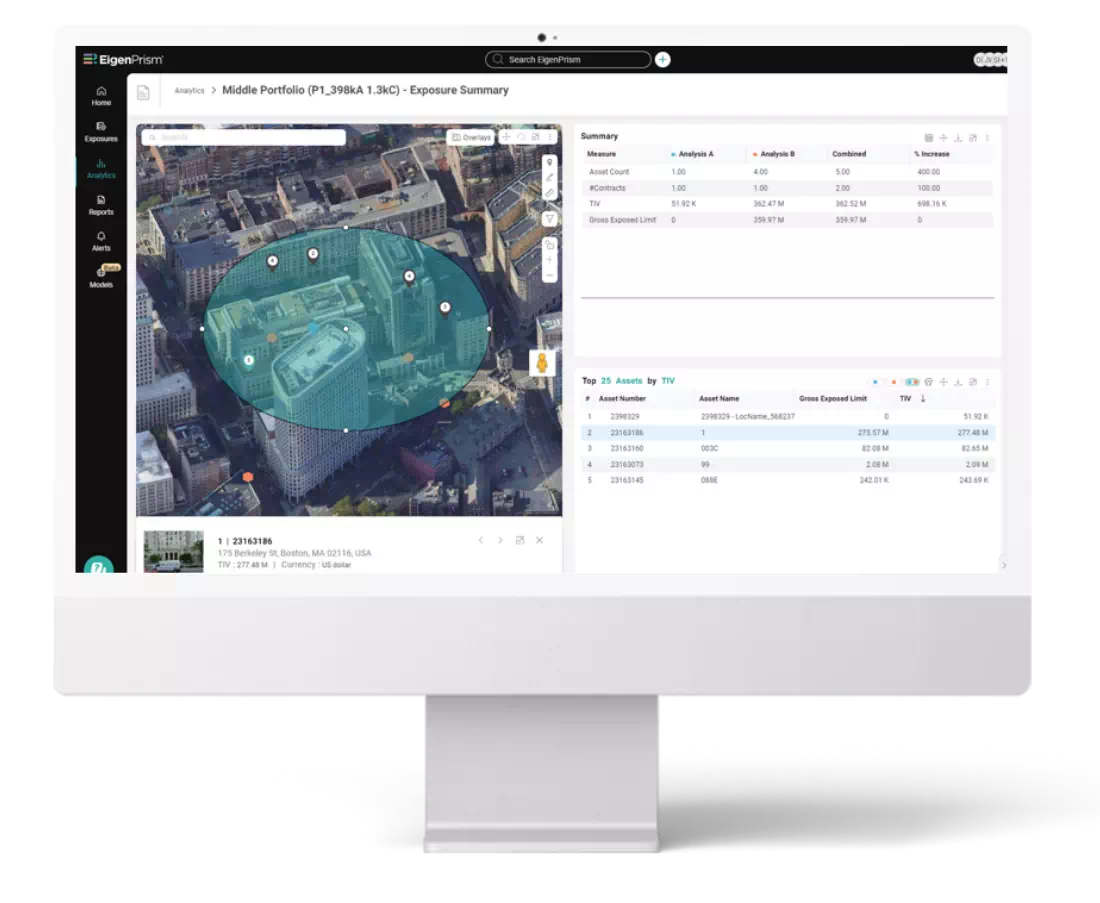
Analyze impact of new accounts on your target portfolio, and zero in on accumulation hot-spots for an enhanced portfolio optimization. Leverage our Portfolio Impact API to automatically flag these submissions as part of your underwriting workflow.
Assess exposure changes to understand the trends and the drivers allowing you to better sense-check the modeled results.
Curate your own view of risk and run deterministic scenarios for emerging perils and under-served regions from our library of hazard maps and scenario models sourced for multiple providers.
Set granular moratoriums using the best-in-class analytics to demarcate specific areas at risk down to ZIP code or census tract level. Keep moratoriums updated using our alerts API to ensure you are always using the latest available information on any event.
One-stop solution for all necessary data providers for policy quoting in a single, unified platform. Eliminate concerns about data governance, maintenance, and updates.
Underwriting
Bring SoVs to life by augmenting 1,000+ data fields from multiple sources for a more detailed view. Use pre-configured report templates to generate powerful exposure profiles that uncover data quality and completeness issues.
Analyze impact of new accounts on your target portfolio, and zero in on accumulation hot-spots for an enhanced portfolio optimization. Leverage our Portfolio Impact API to automatically flag these submissions as part of your underwriting workflow.
Assess exposure changes to understand the trends and the drivers allowing you to better sense-check the modeled results.
Curate your own view of risk and run deterministic scenarios for emerging perils and under-served regions from our library of hazard maps and scenario models sourced for multiple providers.
Set granular moratoriums using the best-in-class analytics to demarcate specific areas at risk down to ZIP code or census tract level. Keep moratoriums updated using our alerts API to ensure you are always using the latest available information on any event.
One-stop solution for all necessary data providers for policy quoting in a single, unified platform. Eliminate concerns about data governance, maintenance, and updates.
Customer Engagement
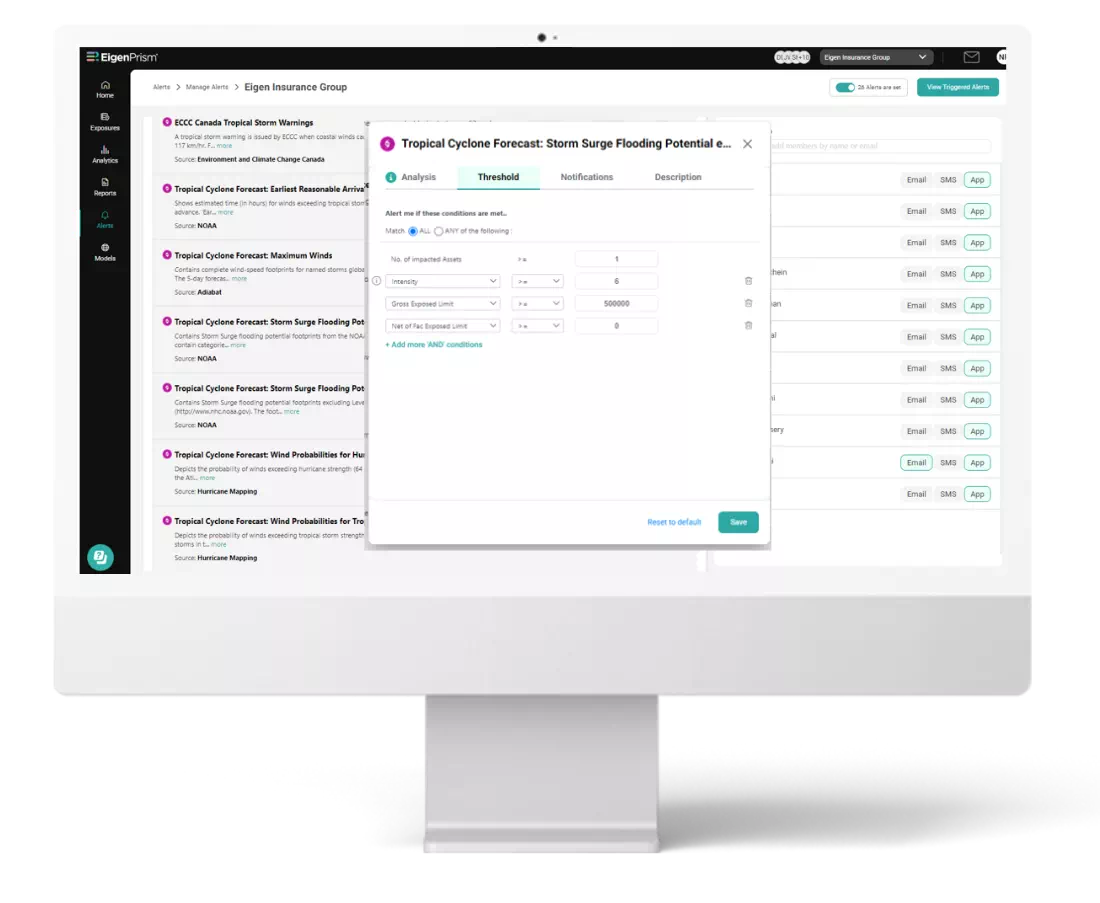
Set up custom alerts with thresholds appropriate to each policyholder for better and timely assistance.
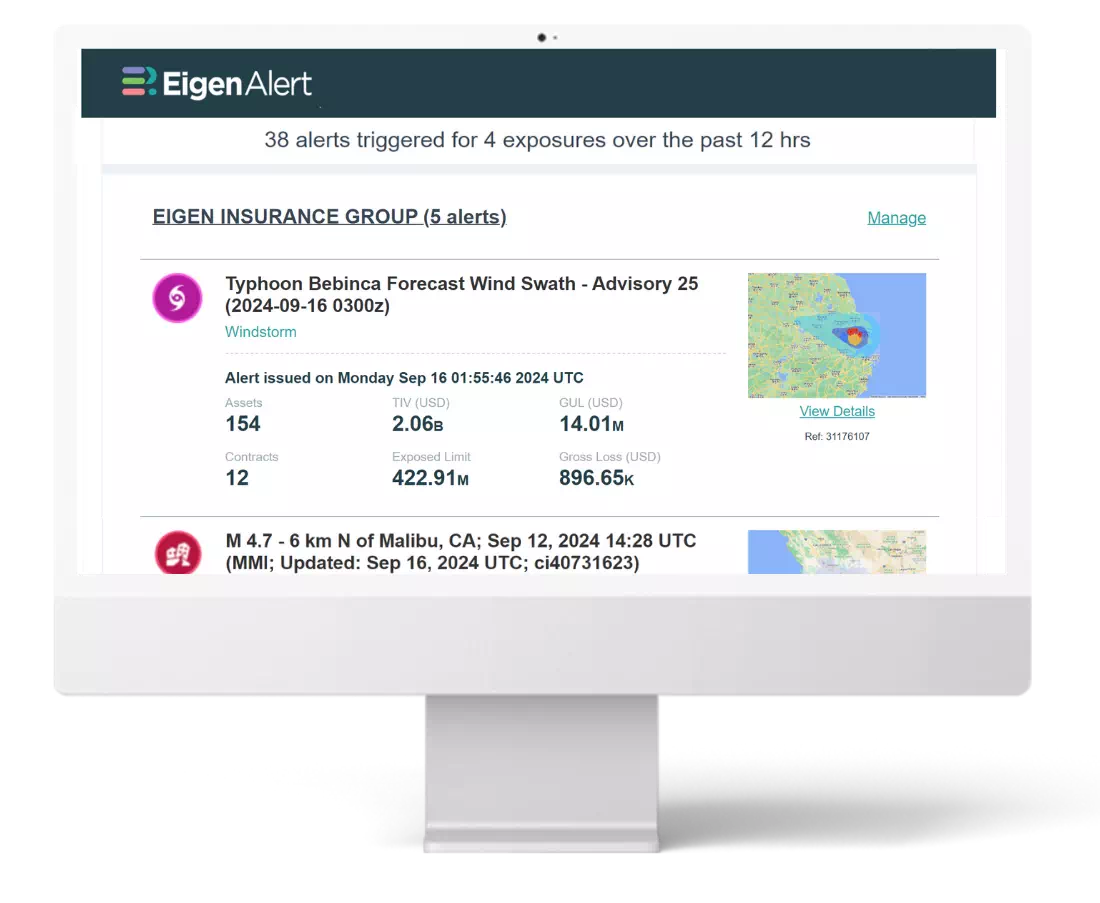
Assist your business with timely alerts for your customers to help fast-track mitigation efforts and drive retention via multiple touchpoints outside the renewal cycle.
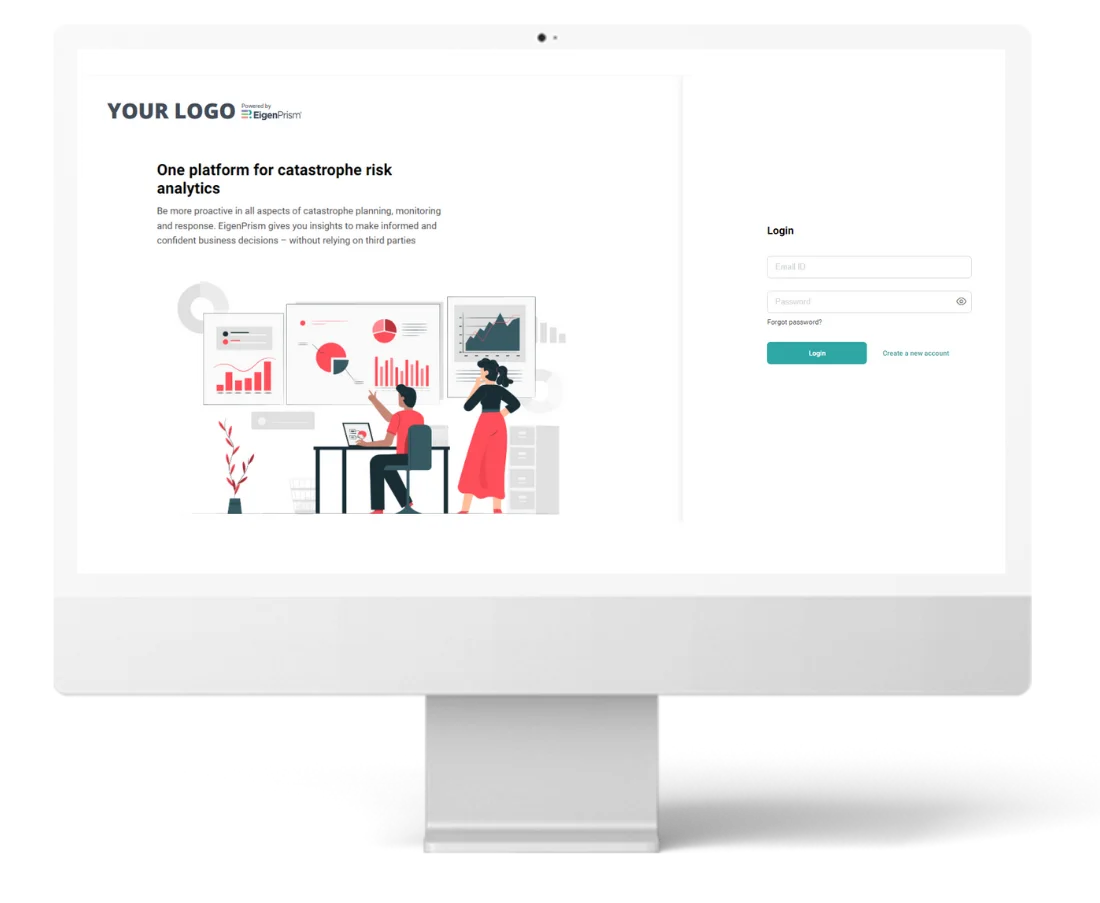
Our APIs allow you to integrate our platform’s features, including catastrophe alerts and visualizations, in your own “white-labelled” solution that lets your brand shine, while reducing your total cost of ownership.
Customer Engagement
Set up custom alerts with thresholds appropriate to each policyholder for better and timely assistance.
Assist your business with timely alerts for your customers to help fast-track mitigation efforts and drive retention via multiple touchpoints outside the renewal cycle.
Our APIs allow you to integrate our platform’s features, including catastrophe alerts and visualizations, in your own “white-labelled” solution that lets your brand shine, while reducing your total cost of ownership.
The specialized technology debate
Based on our experience, we’ve found that it’s not so black and white as build vs buy. A hybrid approach is becoming the way to go. It marries both solutions: building in-house technology and buying where it makes sense to address the specific and customized needs of insurers.
In this guide we’ll cover:
- Why a hybrid approach is the answer.
- APIs: a critical piece of the hybrid puzzle.
- How Swiss Re Corporate Solutions used EigenPrism APIs to supercharge their client portal
- How FBAlliance implemented real-time analytics with automated event response
Reading Time- 20 minutes
Download the ebook now!

Ready to act?
Get in touch
with us today
Discover actionable analytics for overcoming challenges in exposure management, event response, (pre) underwriting and customer engagement