Severe Weather Season 2025: Prepare Now with EigenPrism
The year 2024 saw extraordinarily high losses from natural catastrophes, primarily caused by severe weather in the US. Giant hail and violent tornadoes led to catastrophic damage. These high-end events devastated homes, businesses, and infrastructure, driving up insured losses.
Swiss Re estimates that global insured losses in 2024 exceeded $135 billion, with about $51 billion from severe convective storms. According to NOAA, there were 17 separate severe storm disasters, each causing more than $1B+ in damage throughout the year. Swiss Re’s analysis shows that in 2024, US severe-weather insured losses were about 87% above the 10-year average.
Let’s Look at Two Major Thunderstorm Events from 2024
Tornado Outbreak of May 18 – May 22
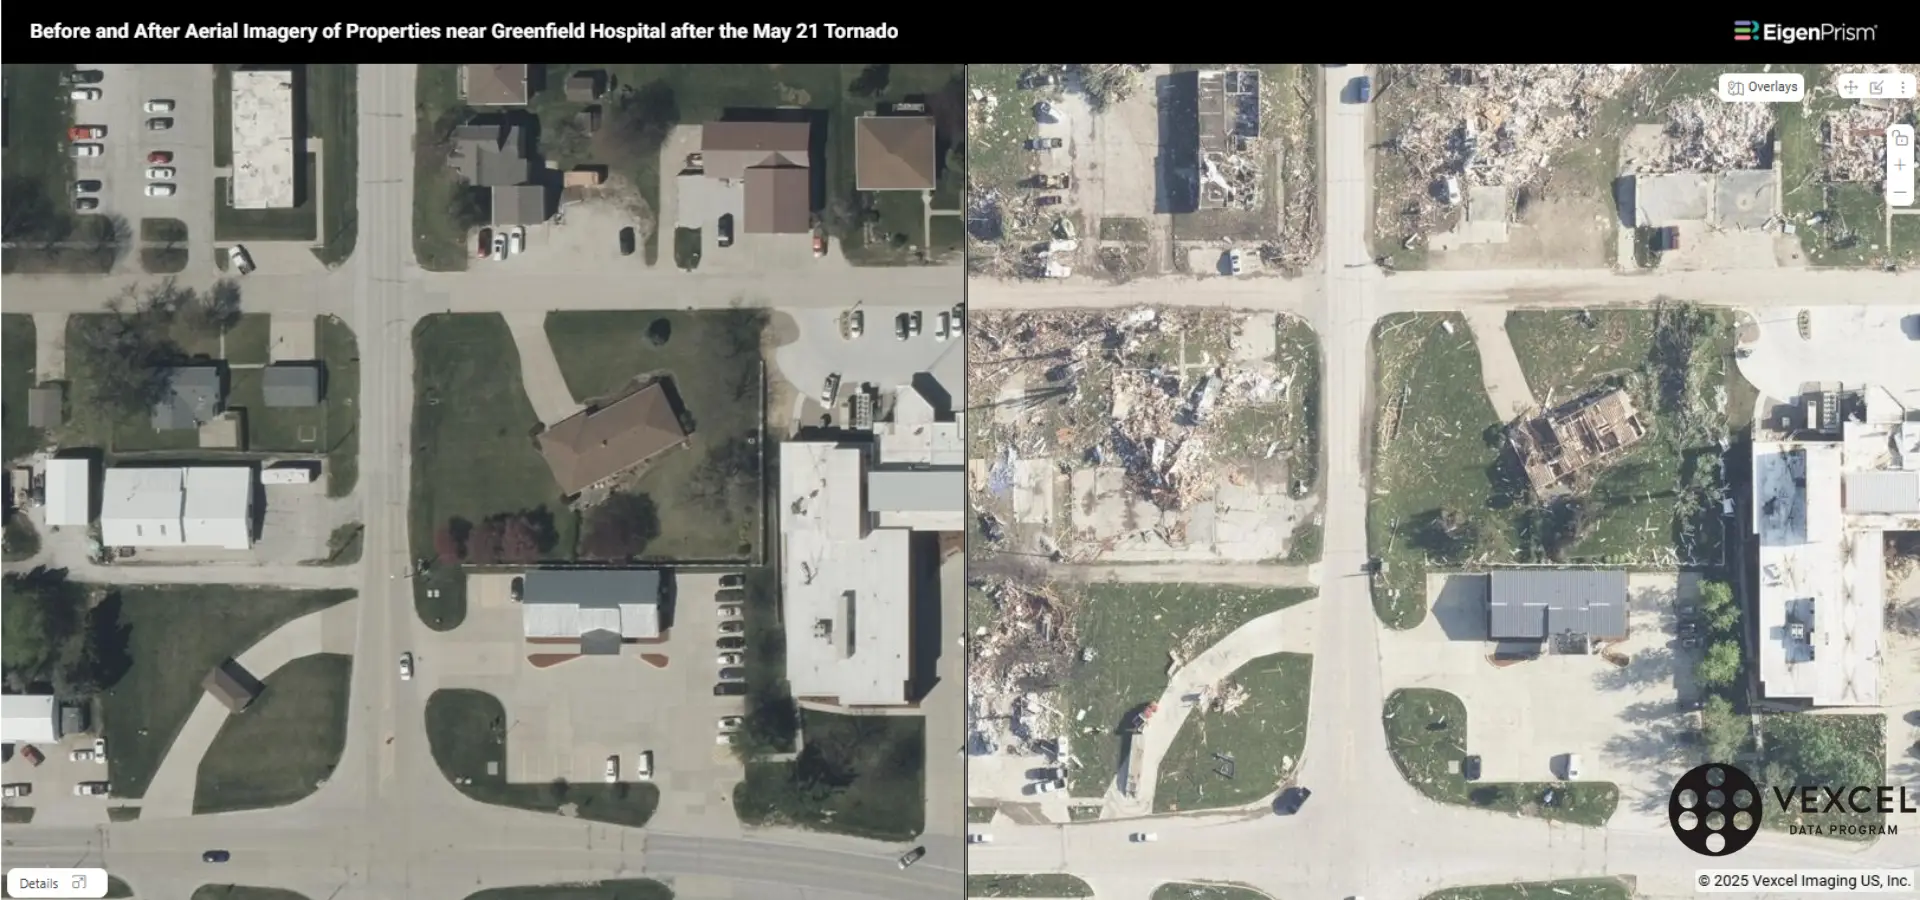
On May 21, a powerful EF-4 tornado with winds up to 185 mph cut a 44-mile path through southeastern Iowa (near Greenfield), tossing cars, ripping homes from their foundations, and heavily damaging the town. During this multi-day sequence, the National Weather Service issued multiple ‘Particularly Dangerous Situation (PDS)’ watches.
- Users of the alerts feature in EigenPrism with assets at risk were notified when the NWS issued its Day 1 Outlook on May 21, 2024. As the NWS released multiple outlooks during that period, users continued to receive alerts tied to those updates, ensuring they could take the necessary measures to protect their assets.
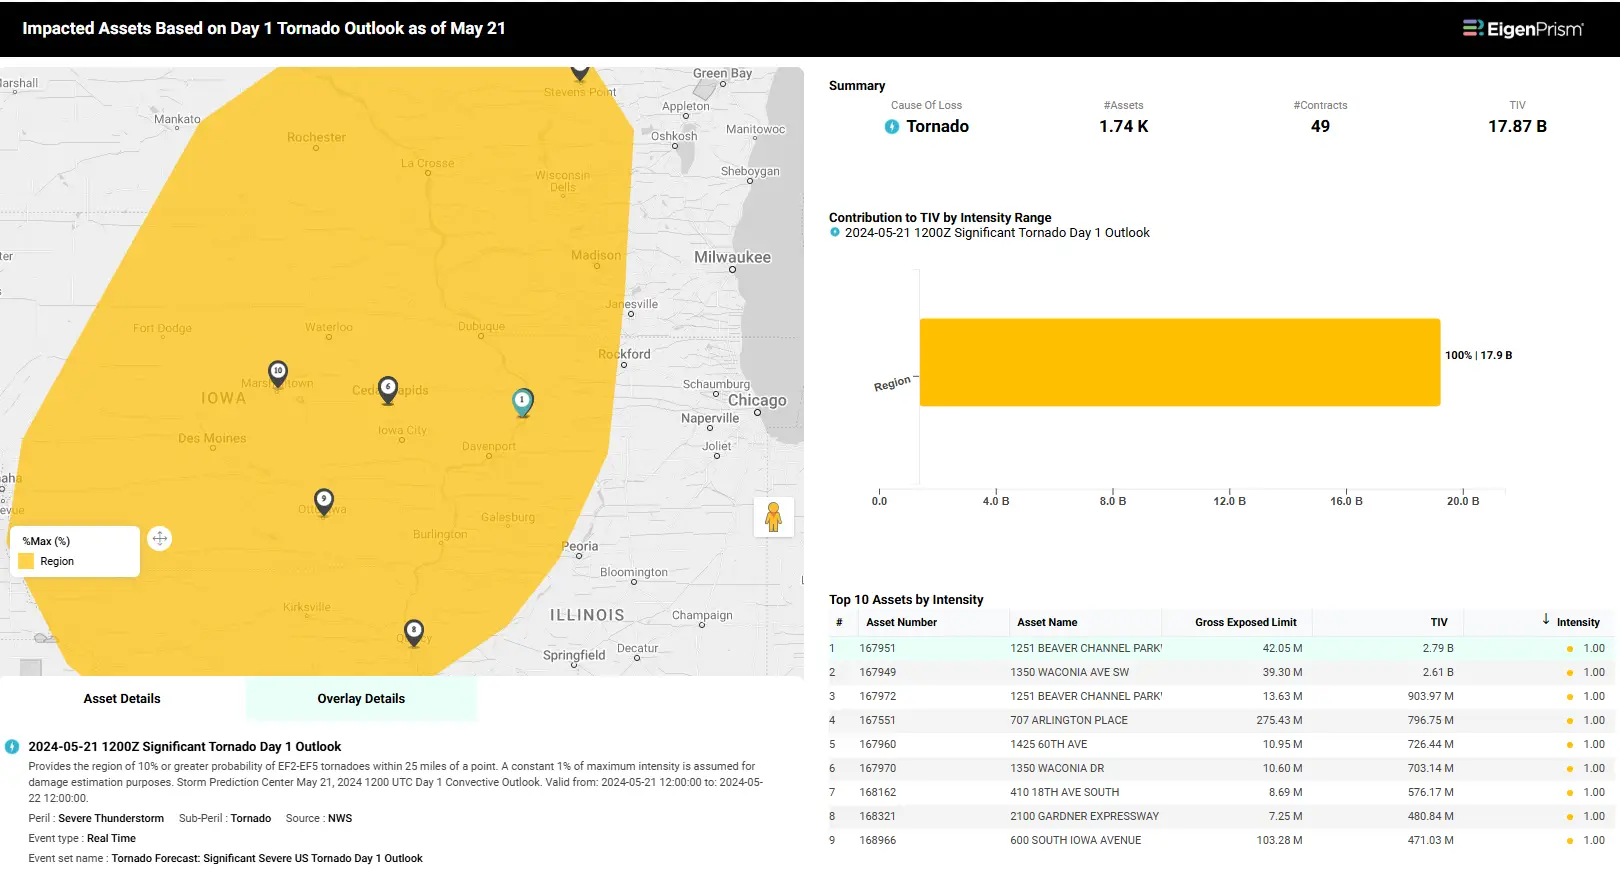
EigenPrism users can click here to launch an analysis on their exposure
- Subscribers of Canopy Weather in EigenPrism were able to take advantage of the proximity zone footprints, which were released just a few hours after the event’s occurrence.
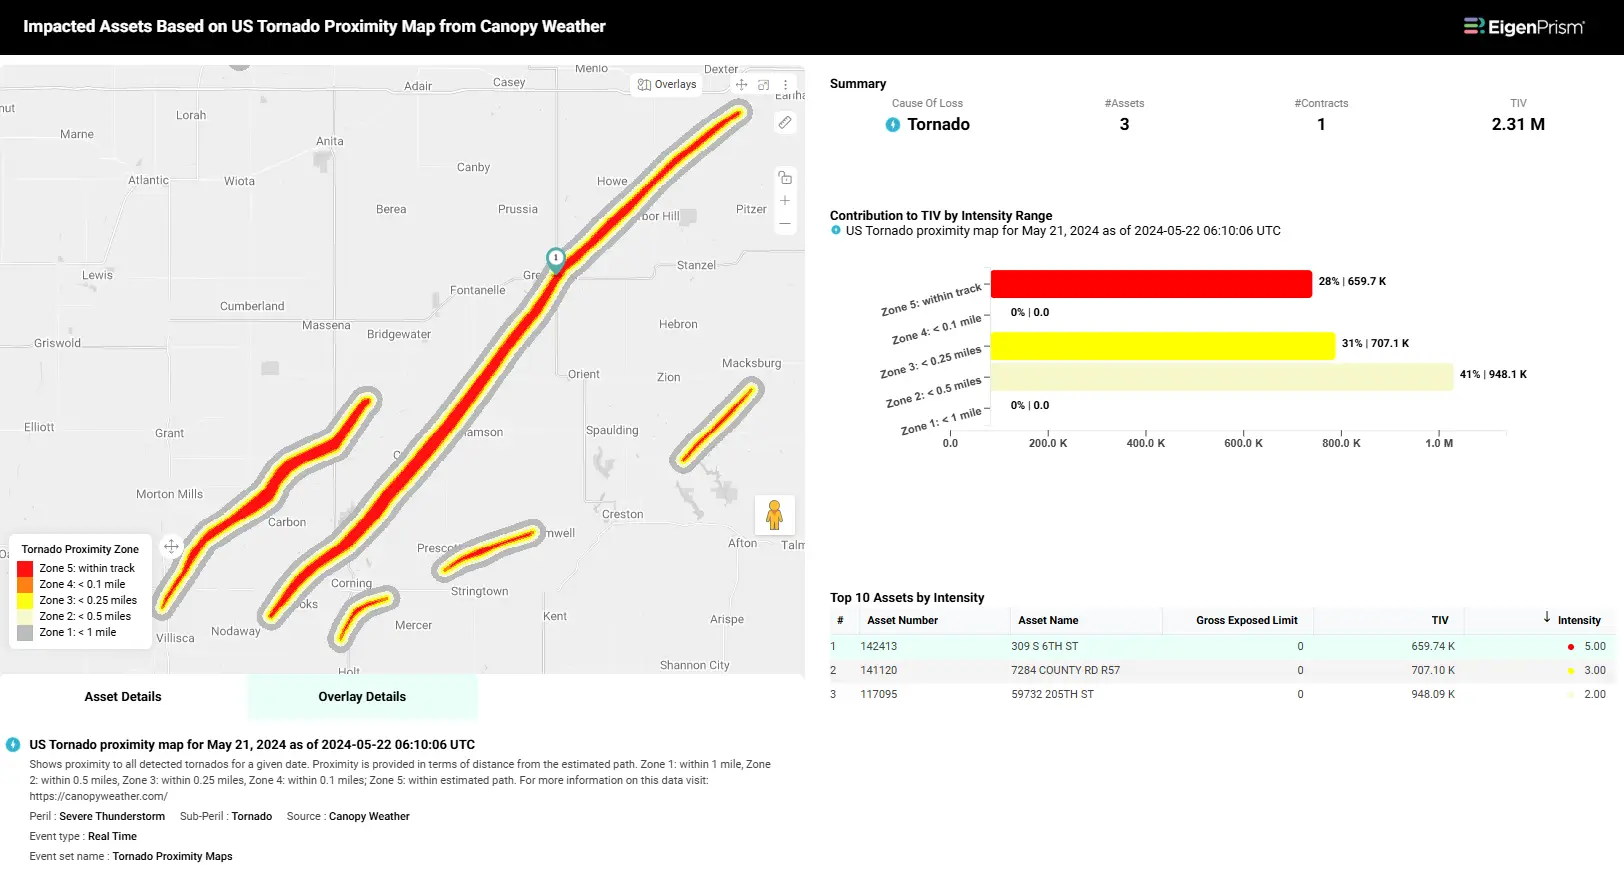
EigenPrism users can click here to analyze their exposure using this event footprint.
- EigenPrism users also made use of the post-event damage surveys from NWS.
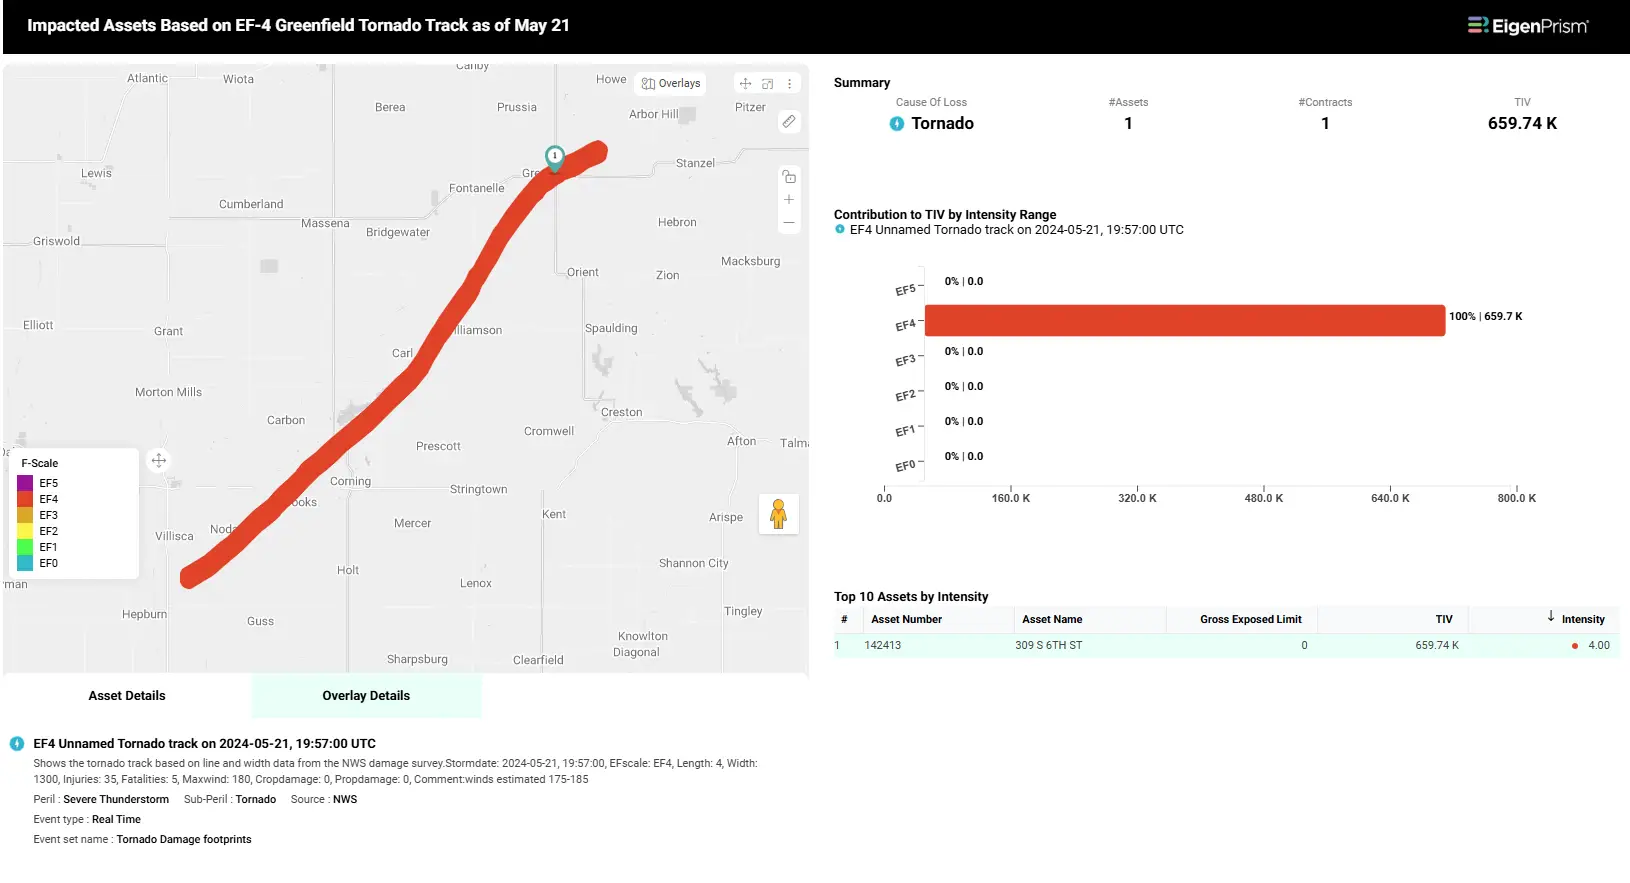
EigenPrism users can click here to analyze their exposure using this event footprint.
Hail Event in Texas on May 09
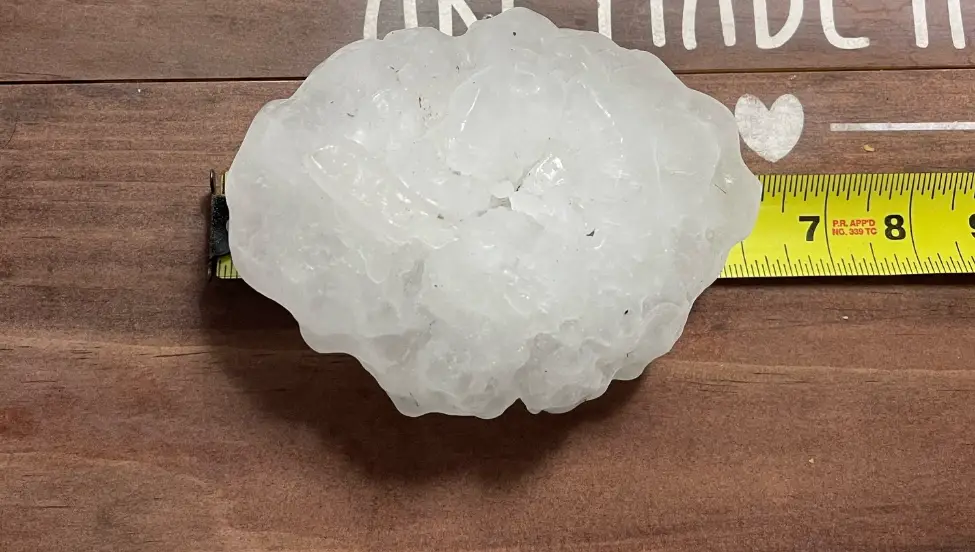
On May 9, 2024, hailstones the size of baseballs hit Johnson City, Texas. The hailstorm caused significant damage to homes and businesses and knocked down power lines and trees. One hailstone was estimated to be 6.25 inches across, which would make it the second largest ever found in Texas.
- Users of the alerts feature in EigenPrism with assets at risk were notified when the NWS released its day 1 outlook on May 09, 2024.
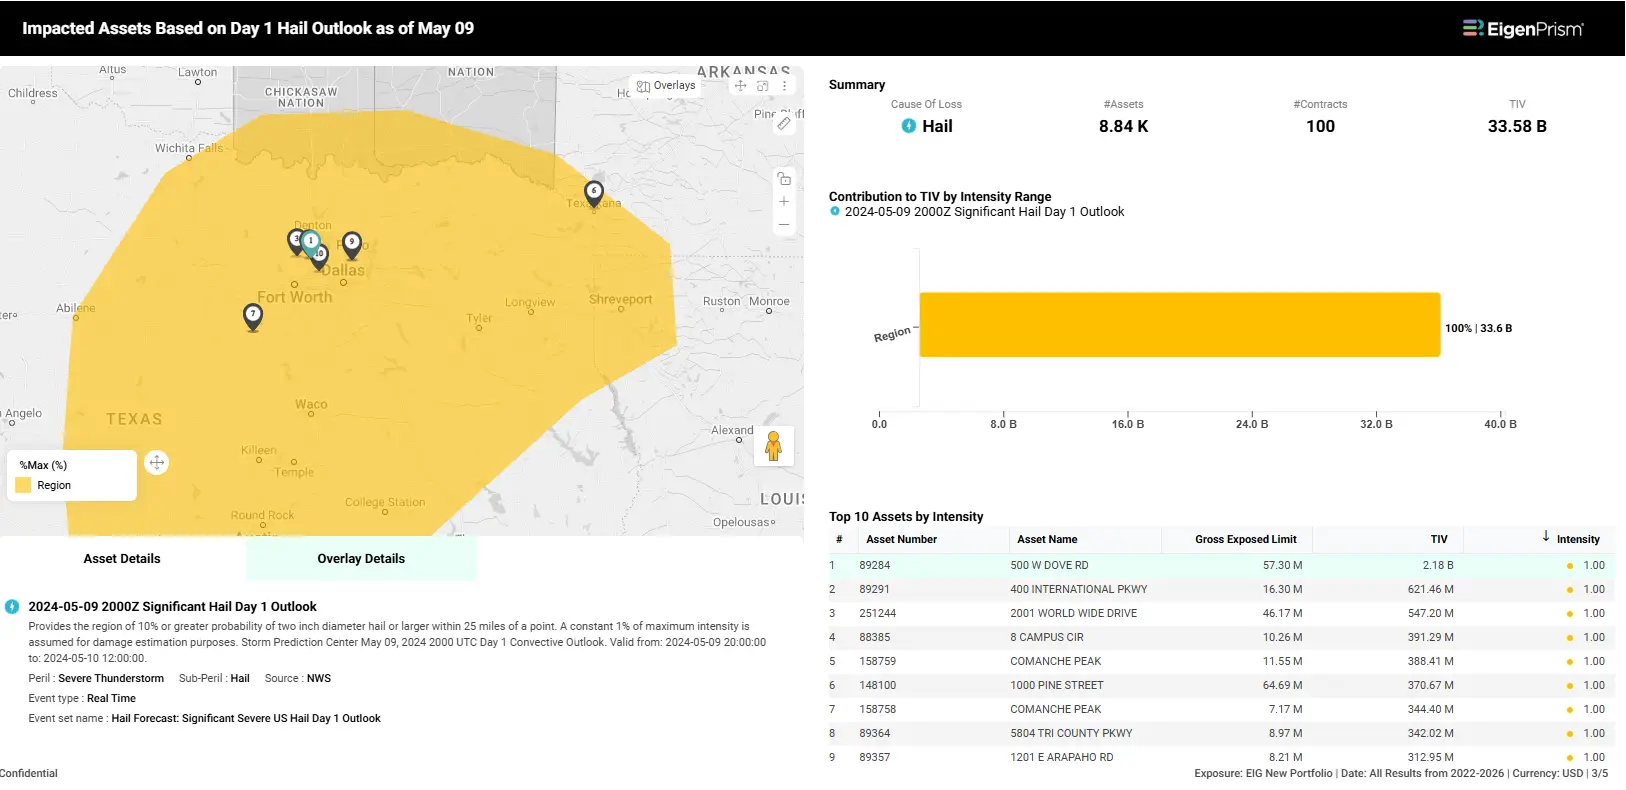
EigenPrism users can click here to analyze their exposure using this event footprint.
- After the event, EigenPrism users were able to make use of the following post-event footprints.
1. Daily CONUS Hail Swath Map as of May 09, 2024 (for subscribers of Canopy Weather in EigenPrism)
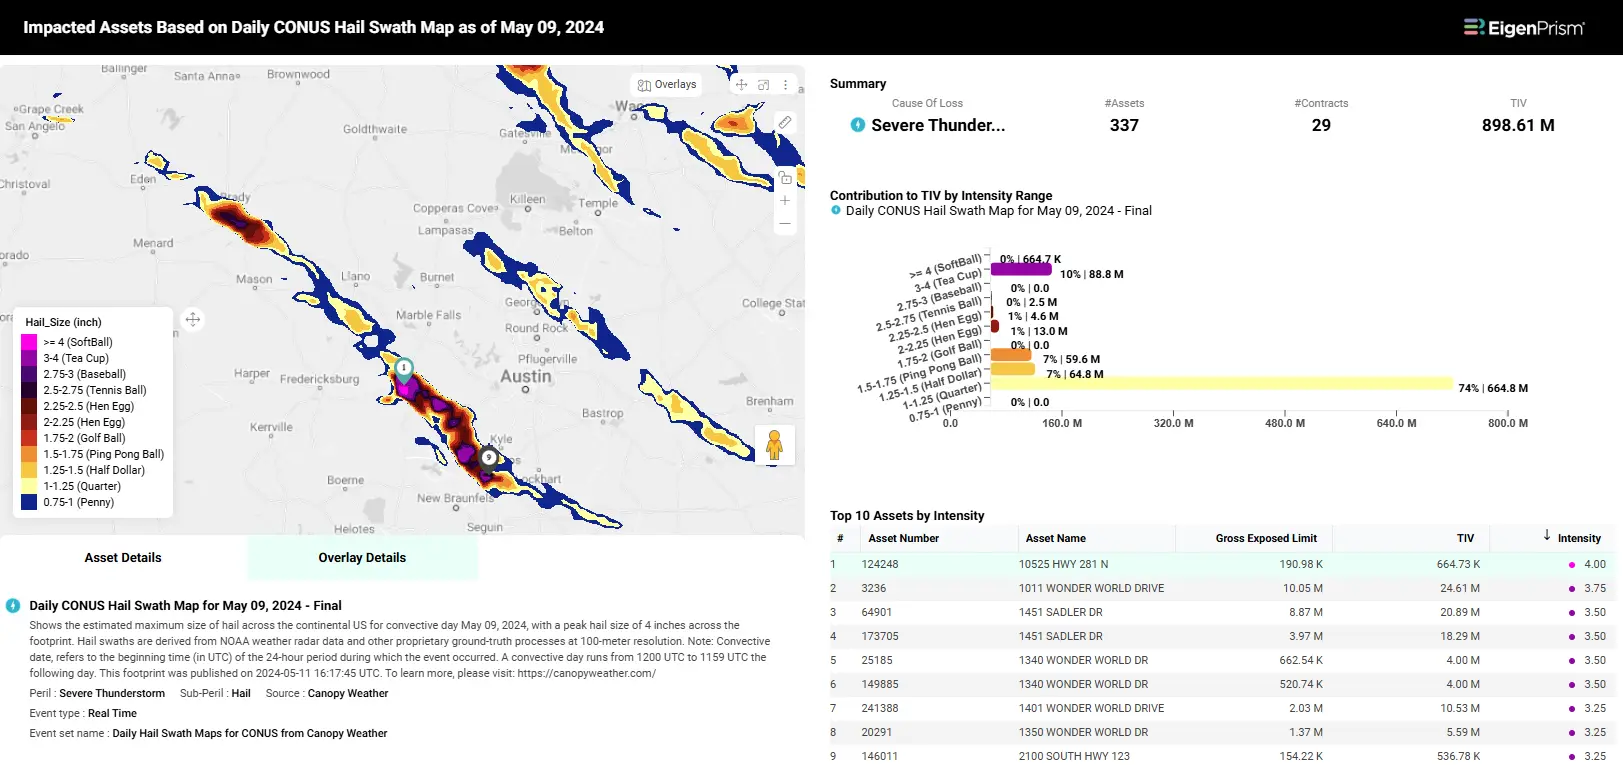
EigenPrism users can click here to analyze their exposure using this event footprint.
2. 24-hr Hail Swath MESH Ending May 09 from NSSL.
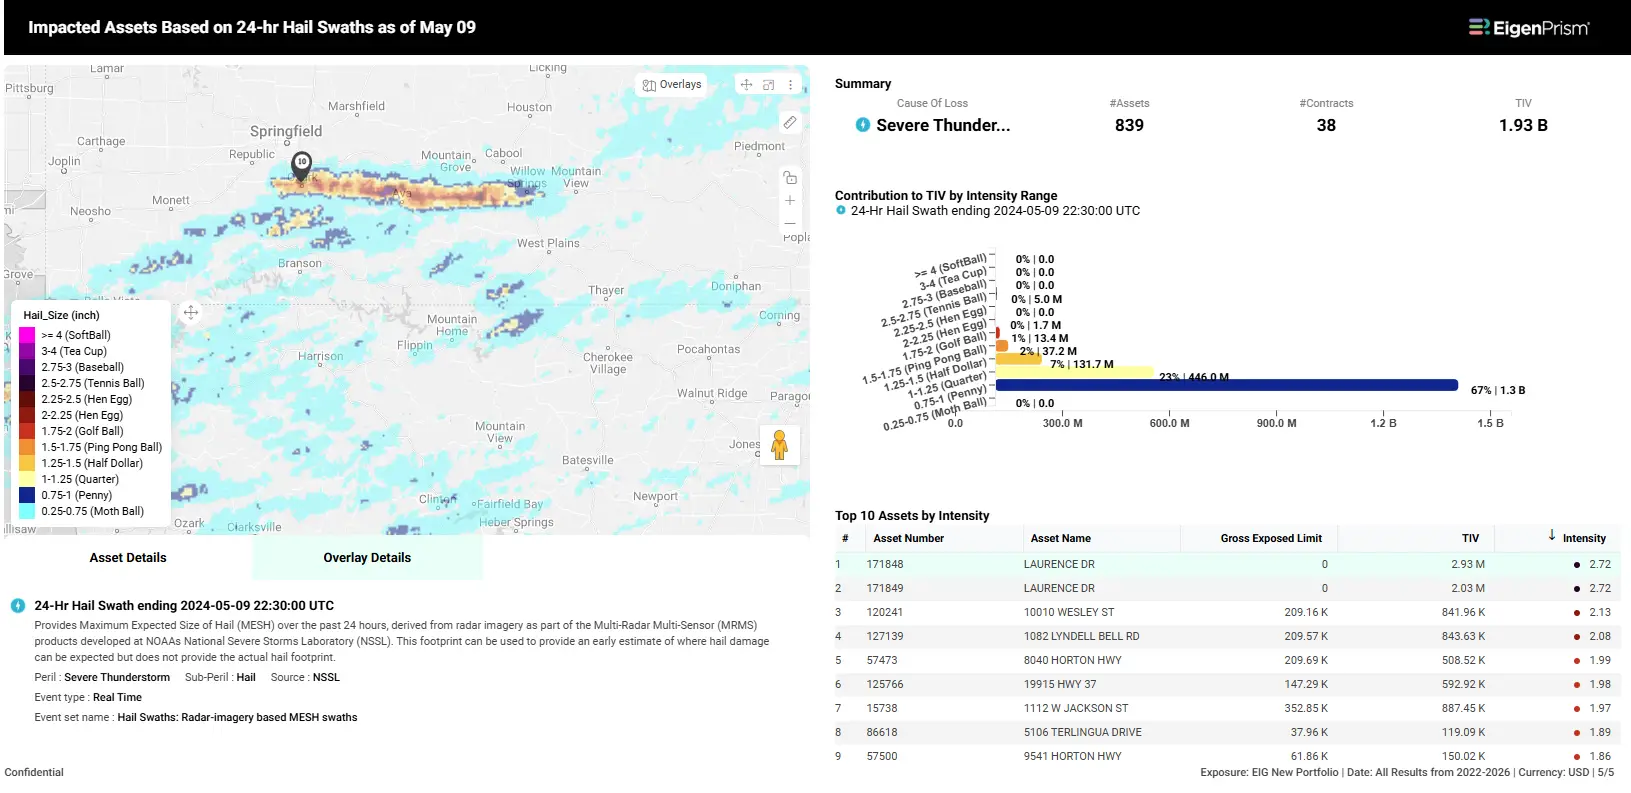
EigenPrism users can click here to analyze their exposure using this event footprint.
How Do EigenPrism Users Prepare for the Upcoming Severe Weather Season
1. Ready Exposure Data
Your analytics are only as good as the accuracy of your data; therefore, it’s essential to ensure your data is complete and up-to-date. Here’s what EigenPrism users do:
Update Data
- Maintain Data Relevance and Accuracy: Property values and other variables can change over time. If you utilize Schedules of Values (SoVs), regularly check data changes and import your SoVs again. This help center article can guide you through the process of importing an SoV quickly.
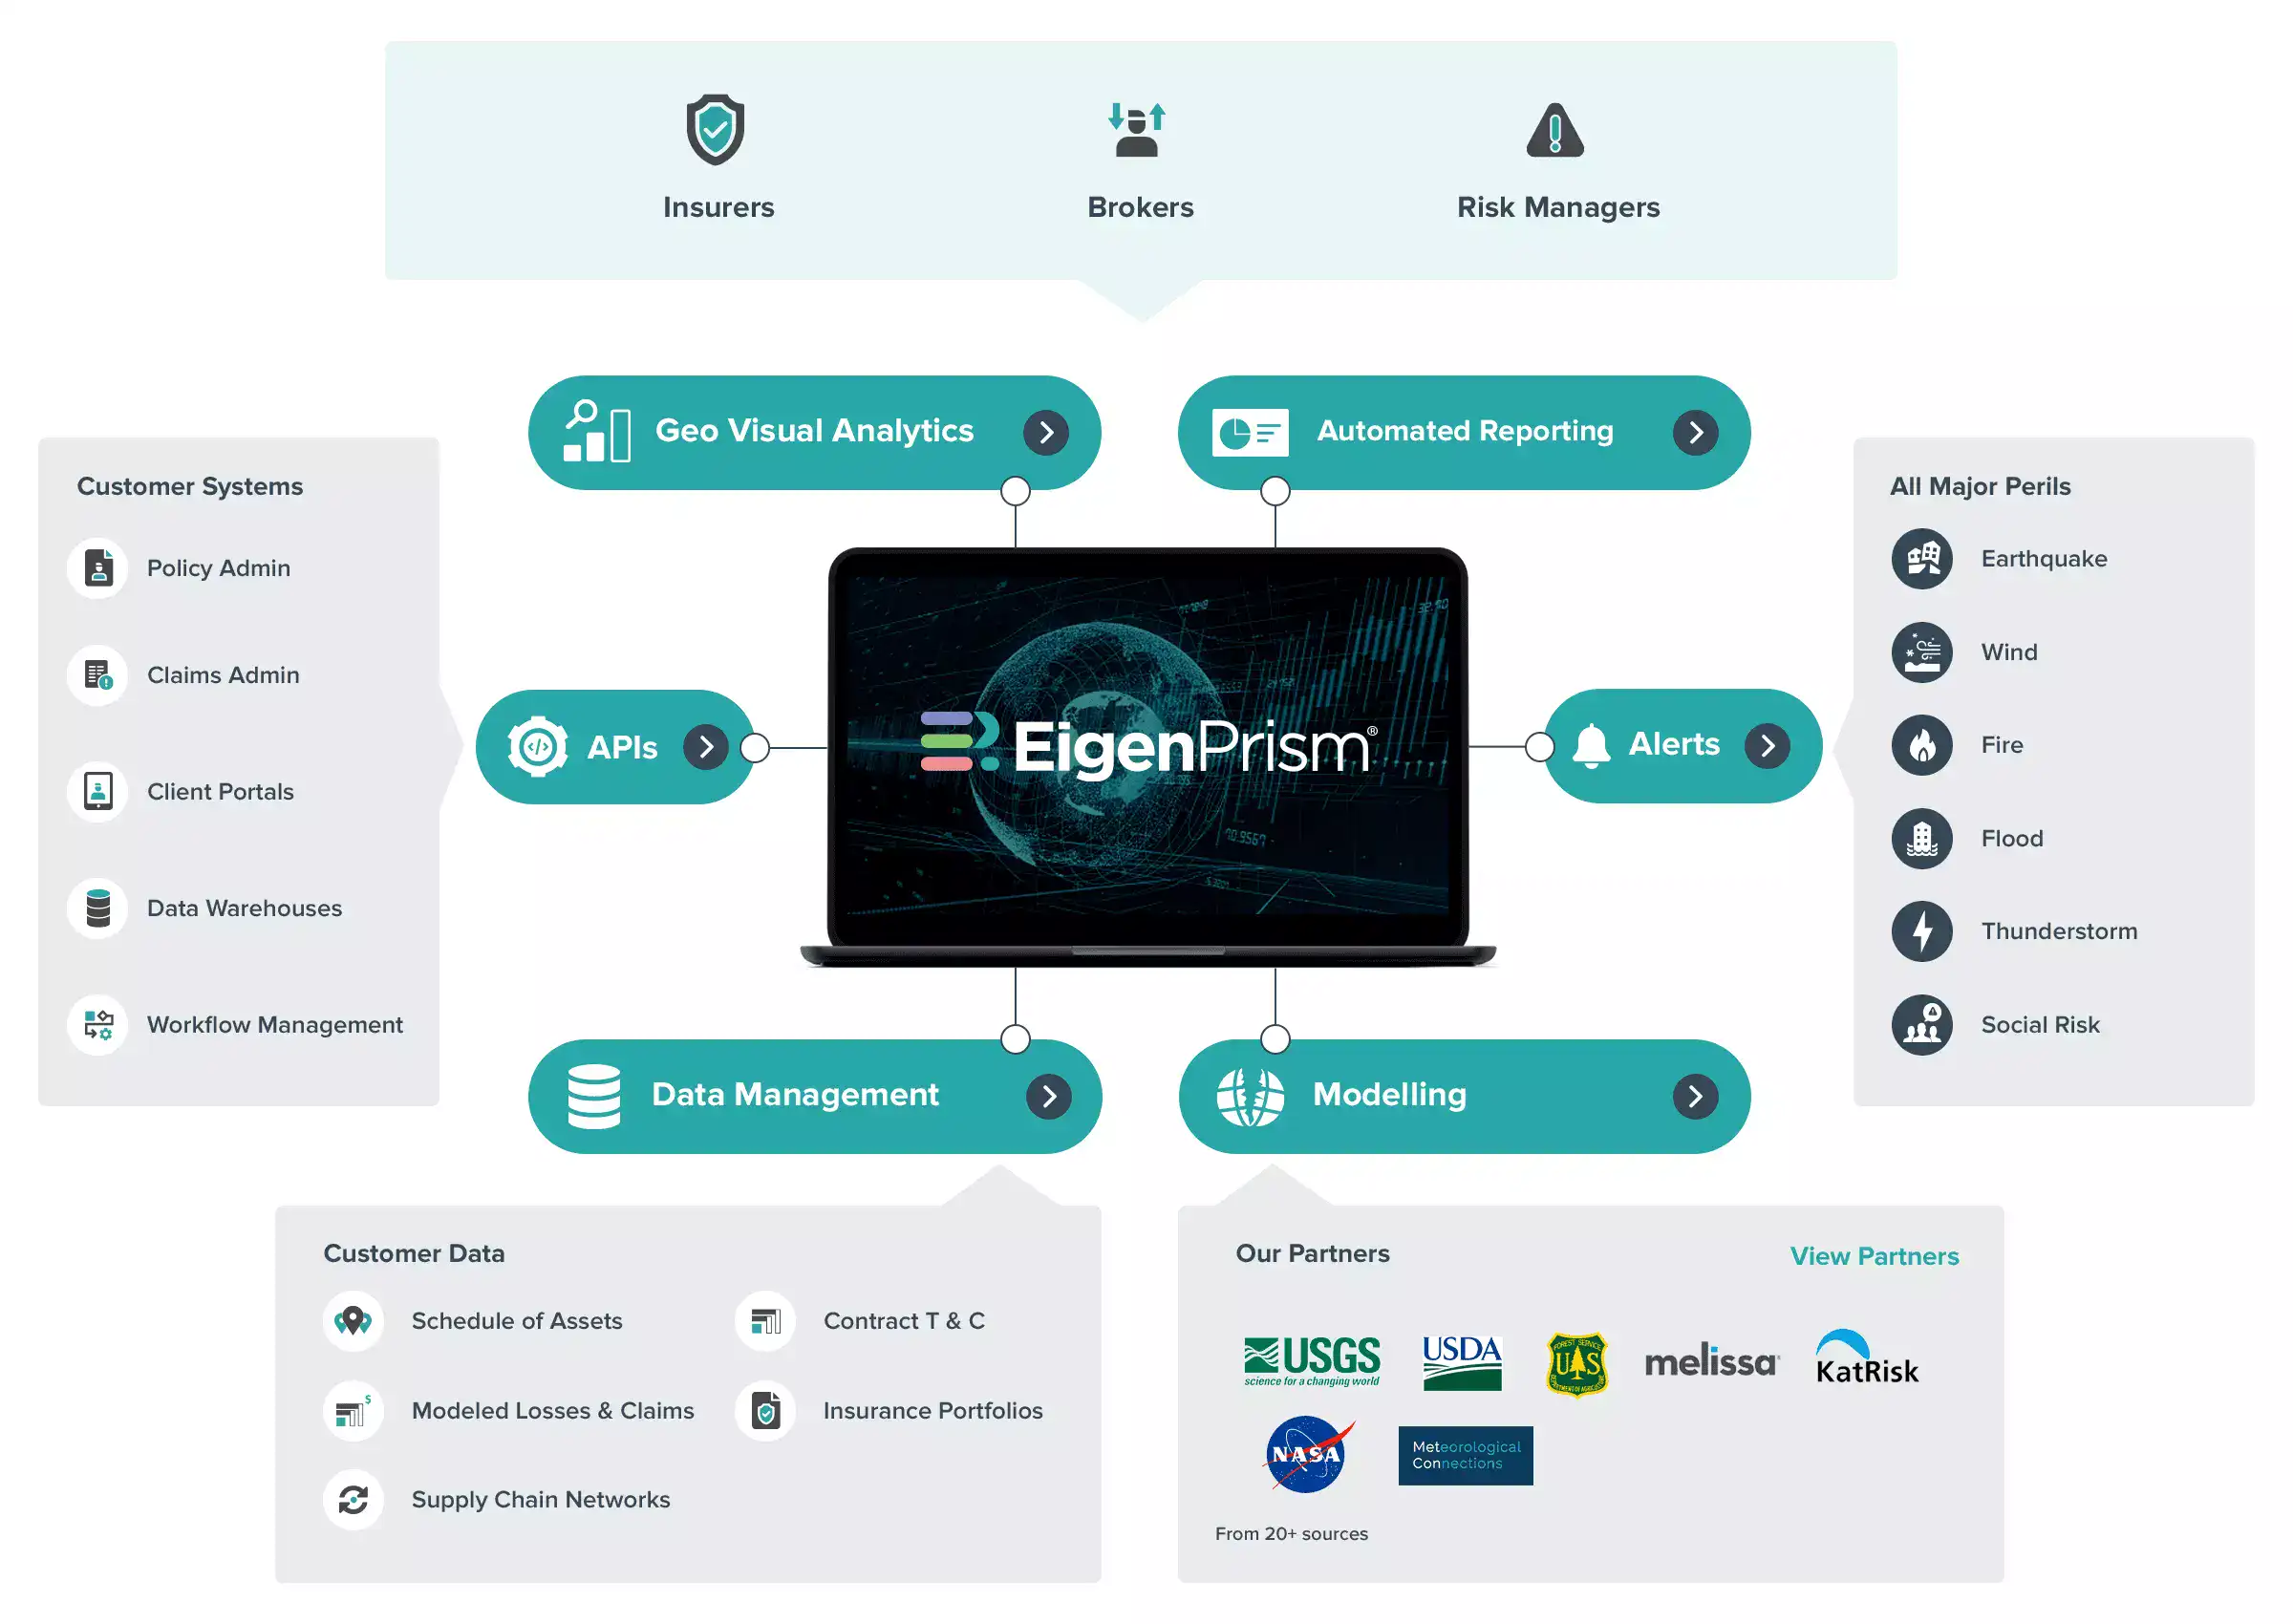
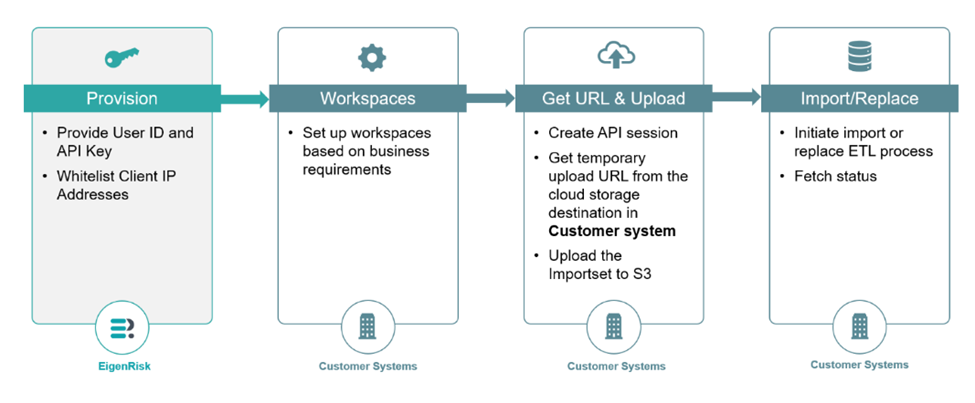
- Leverage APIs for Efficiency: Our APIs automate the entire process of exposure data import and update. Discover how to use APIs to keep your exposure data refreshed and aligned with the latest updates.
Improve Data Quality
Ensuring high data quality is crucial when importing data into the system. Here’s how EigenPrism users enhance their data quality.
- Leverage Geocoding: Geocoding lays the foundation for all subsequent activities. Incorrect geocoding of assets can lead to inaccurate analysis results, missed critical alerts, or false alerts for assets not affected by events. Utilize EigenPrism’s geocoding capabilities to ensure accurate geocoding of your assets.
- Utilize Data Augmentation: By employing our augmentation capabilities and leveraging EigenPrism’s partnerships with data providers like HazardHub and Tensorflight, you can keep your COPE (Construction, Occupancy, Protection, and Exposure) data current. Additionally, Including replacement cost data during augmentation can be very useful during loss adjustment.
- Check your data quality: If your exposure data is in the system, use the exposure stratification analysis to assess data completeness at a glance.
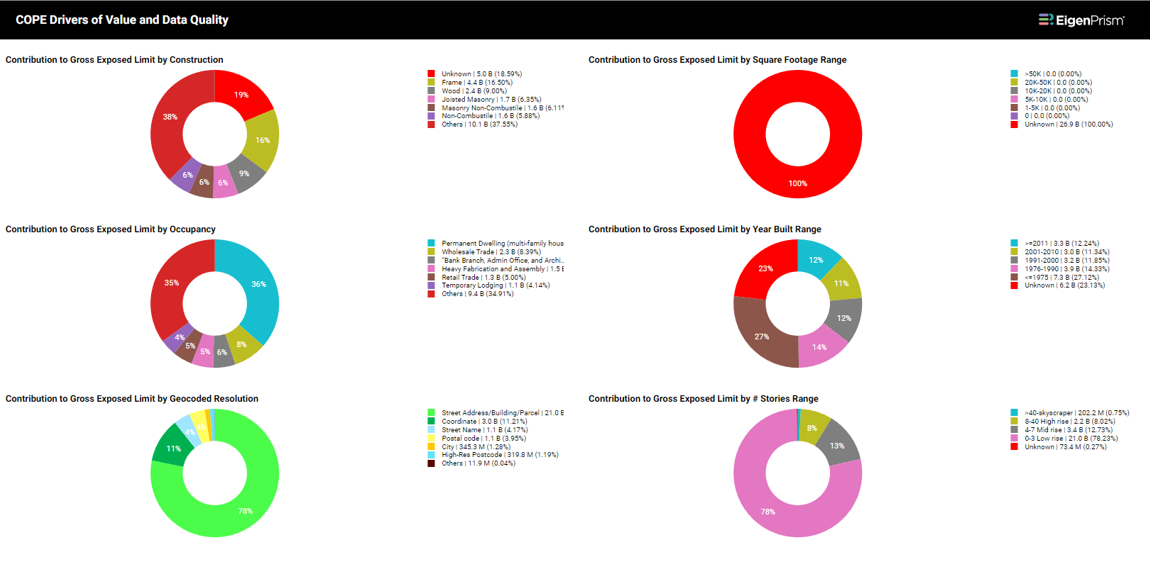
If you discover any discrepancies or unknowns in these charts, this is the perfect time to update your data. Utilize our geocoding and data augmentation services to enhance accuracy.
Click here to check the data quality of your exposure immediately.
2. Prime the Pump
Waiting for the first catastrophe to occur is not an option. Proactivity is essential in disaster preparedness. Here are key steps to ensure you’re ready ahead of time.
Monitor Accumulations
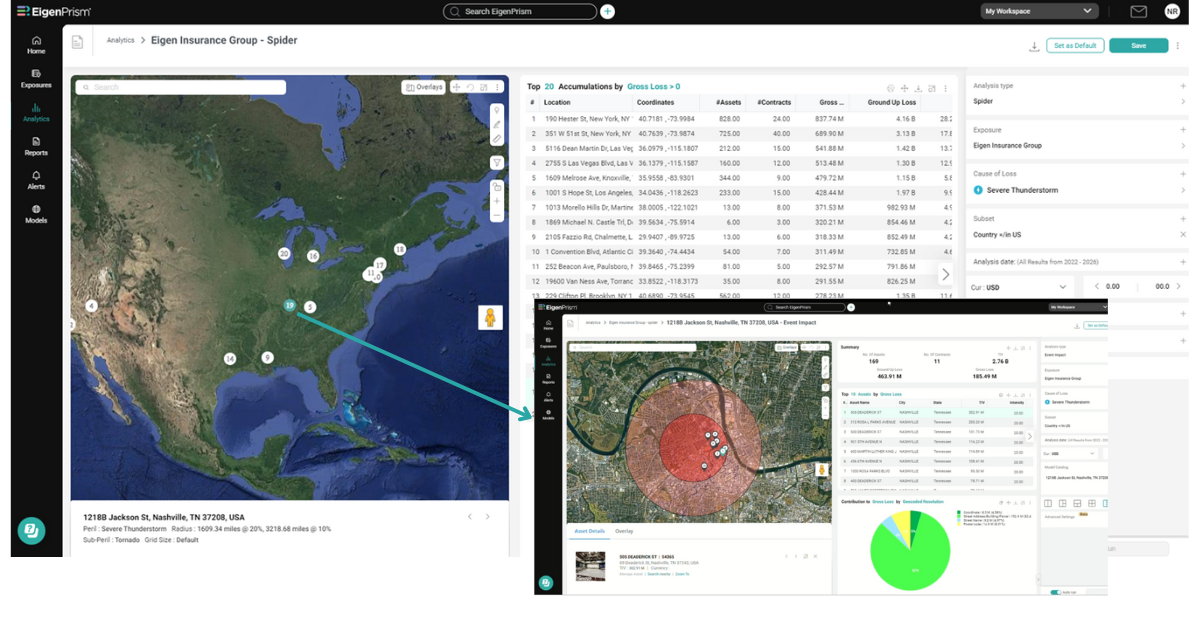
Identify critical accumulation hotspots automatically with spider analysis. This analysis type allows for a precise understanding of the concentrations of risk in your portfolio. You can review the accumulations and can also further delve deeper into any specific concentration. Learn more about how to use a spider analysis.
Create What If Scenarios Using Historical Events
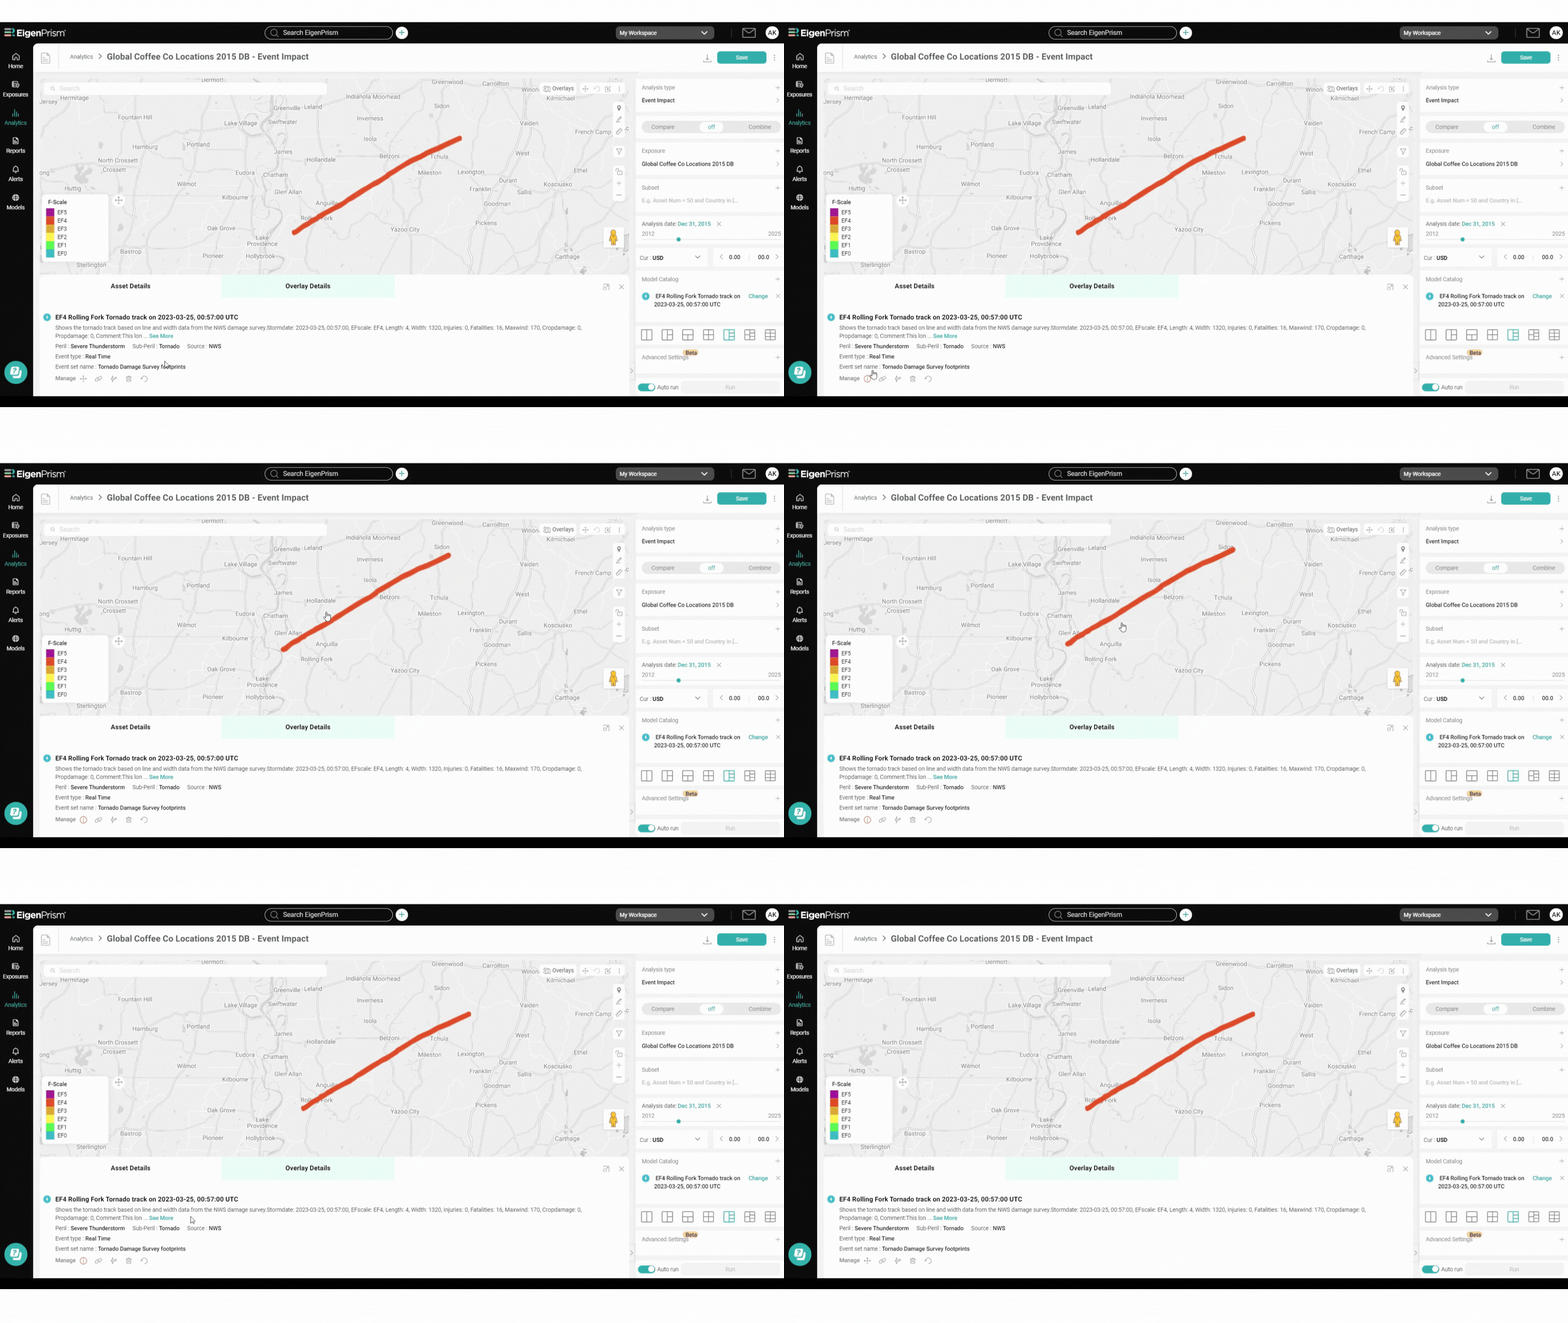
Move historical footprints to create what-if scenarios, providing insights into potential future impacts based on past events. Below is an example of us moving the EF4 Rolling Fork tornado damage survey from NOAA.
Leverage the Report Library
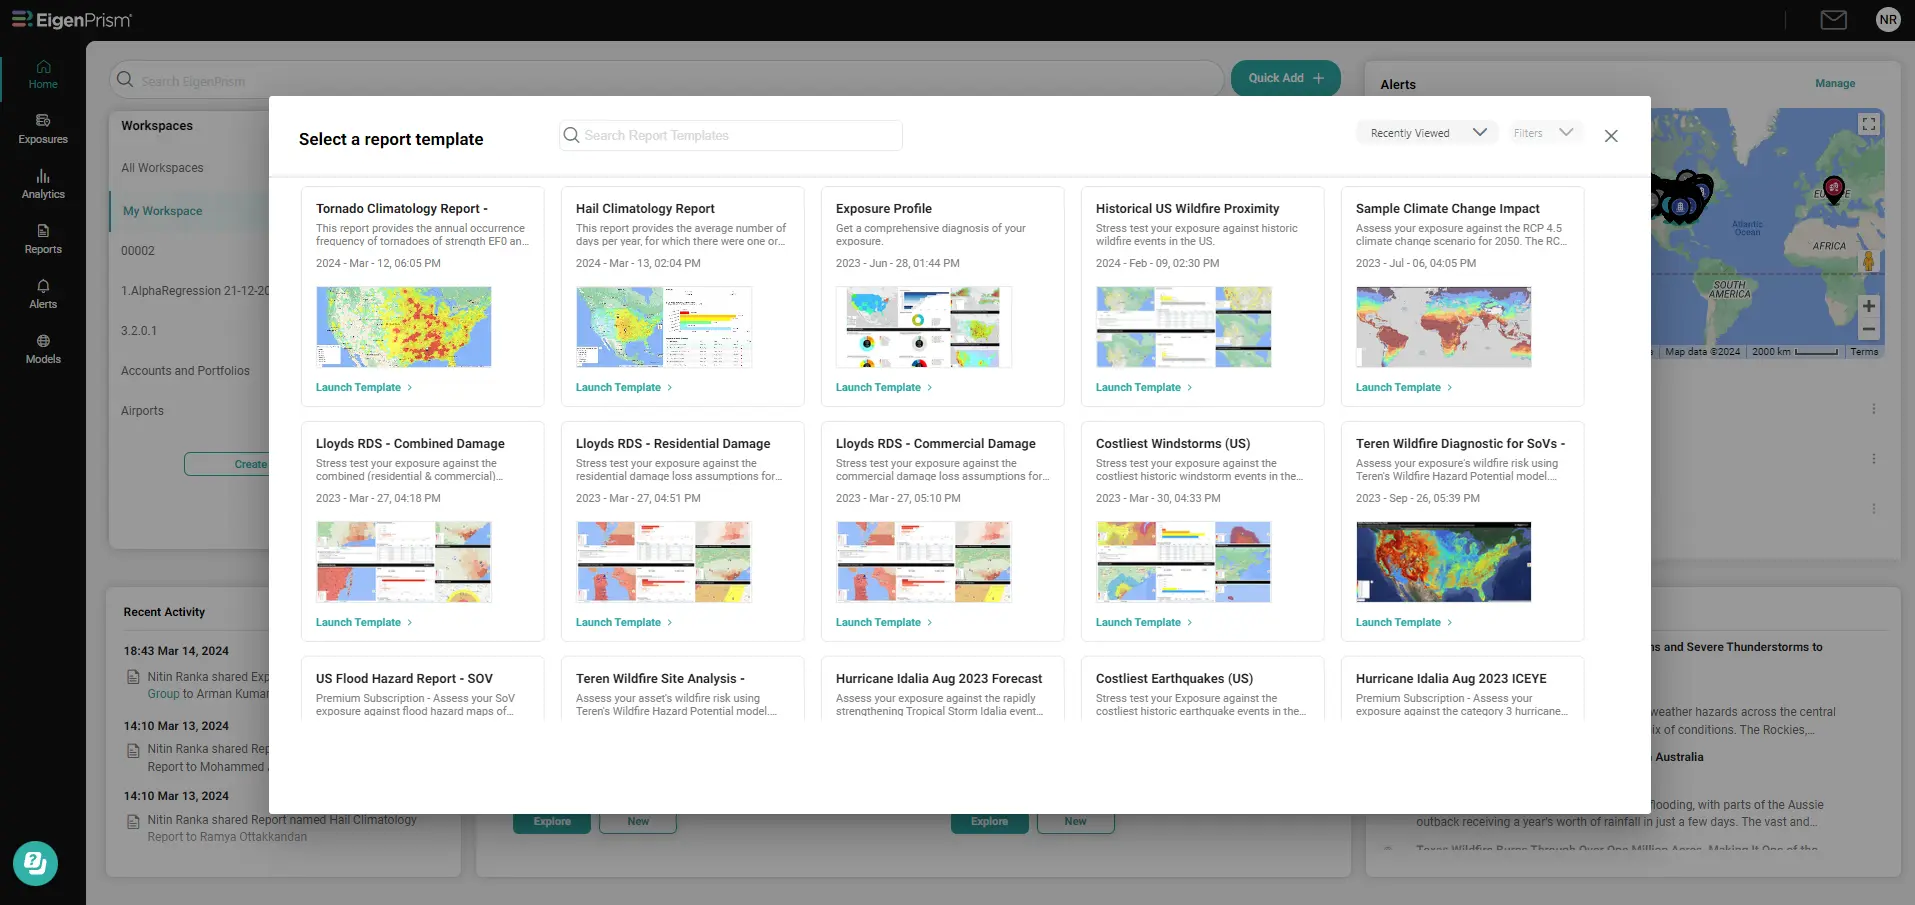
EigenPrism users benefit from our extensive collection of report templates that generates multi pager reports at the click of a button. Access the report library easily by clicking the ‘Quick Add’ button on the homepage and selecting ‘Reports.’
Two report templates that are relevant for the severe weather season are:
This report provides the annual occurrence frequency of tornadoes of strength EF0 and higher, approximately 25 miles of historical tornado track. These frequencies are based on an analysis of historical data sourced from the NOAA’s Storm Prediction Center (SPC) for three time — periods: 5 years, 10 years, and 74 years, each ending in 2023.
This report provides the average number of days per year, for which there were one or more hails of size greater than 1 inch, within 25 miles of historical hail point. These average days are based on analysis of historical data sourced from NOAA’s Storm Prediction Center (SPC) for three time periods: 5 years, 10 years, and 69 years, each ending in 2023.
Run Frequency Maps
Utilize frequency maps based on historical data to gain insights into the annual occurrence rates of hail or tornadoes.
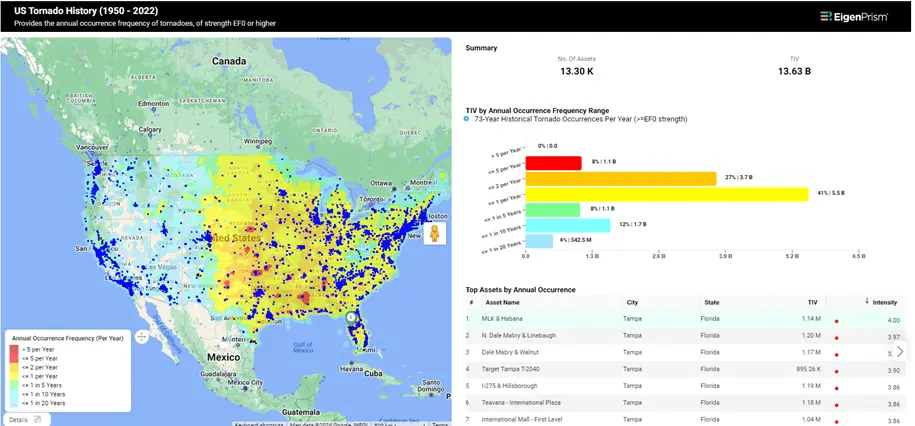
These maps give you an understanding of the average annual occurrence of events based on the defined time-frames and the intensities of the events. Viewing these in context of your exposure data allows you to get a better understanding of your risk.
Click here to run a hazard overlay analysis. You will find these events in the hazard tab of the model catalog.
Set and Review Moratorium Criteria
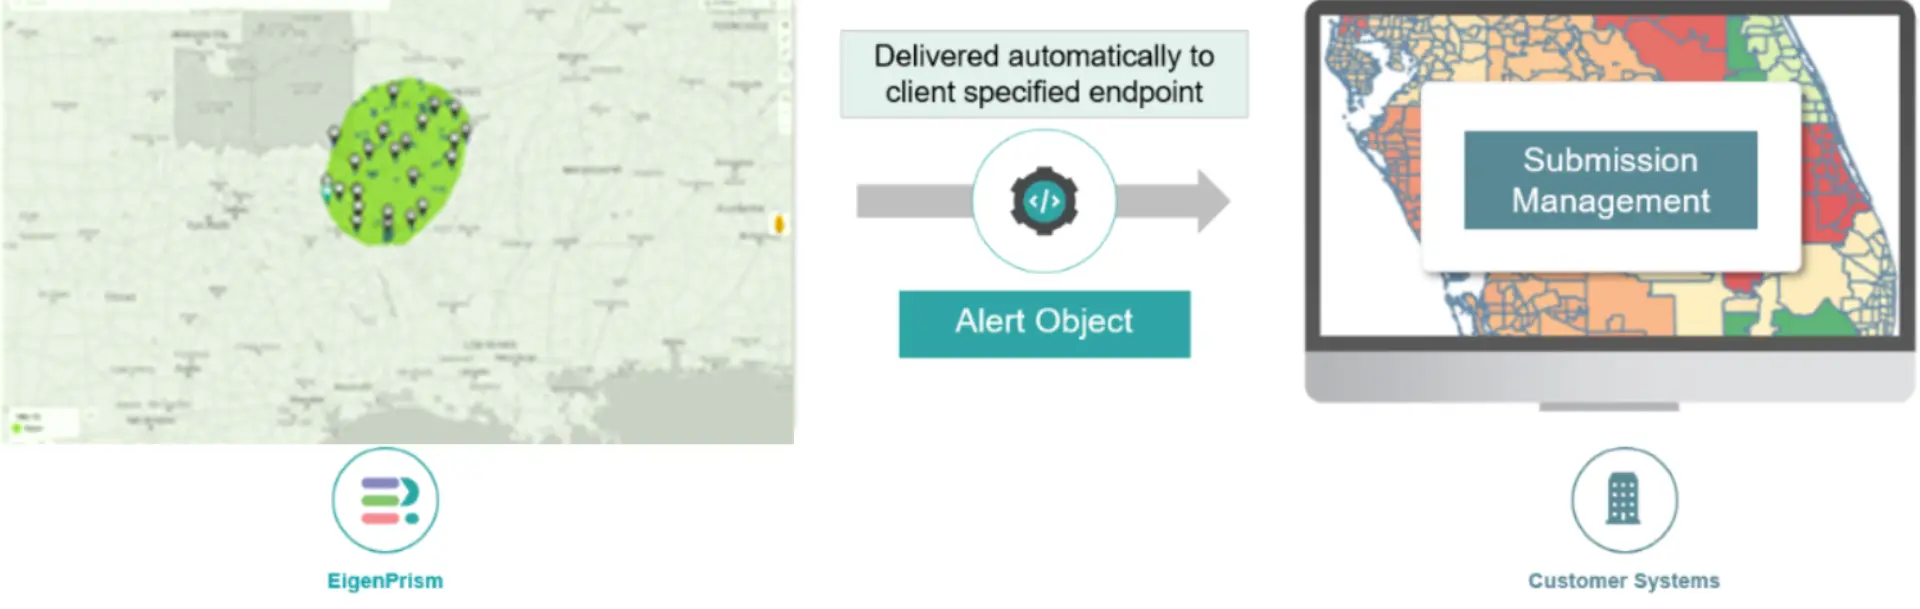
Leverage granular intelligence to set and review underwriting moratoriums. This case study outlines how Vave was able to integrate real-time catastrophe event notifications and analytics into the technology and Vave’s automated underwriting process. This enabled them to automate issuing underwriting moratoriums during a catastrophe and ensured that underwriting resumed post-event – entirely without manual intervention.
3. Set Alerts on Exposures
Monitor observed and forecasted events, and receive notifications of events that impact your assets effortlessly with a single click, using alerts.
Set EigenAlerts
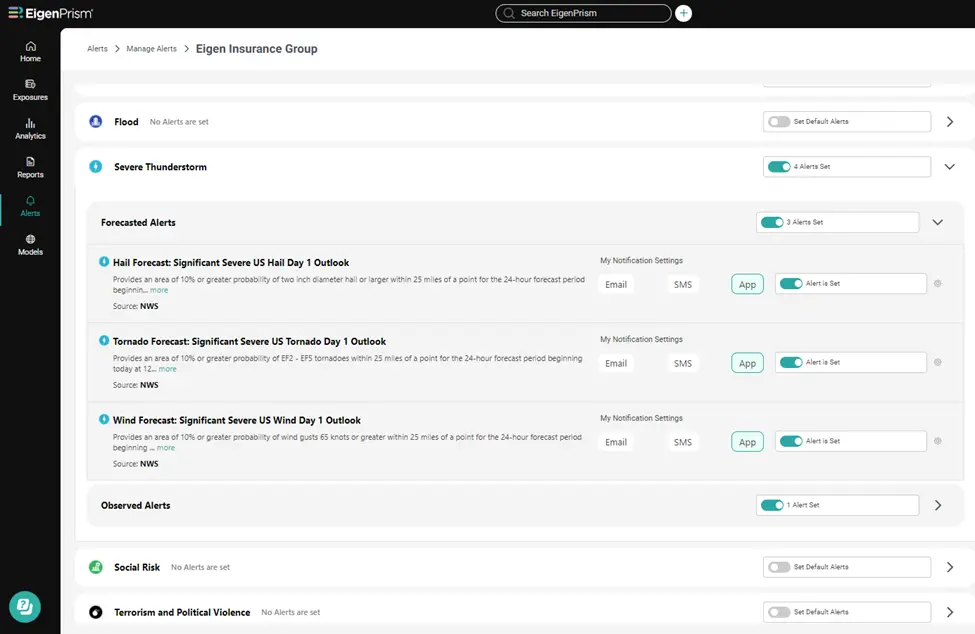
EigenPrism users customize their alerts to be both highly targeted and actionable. By configuring alert thresholds and notification frequencies, they ensure their attention is focused solely on events directly impacting their assets.
Set your alerts now.
Check Out Our Upcoming Webinar
Check Out Our Webinar On Severe Weather Preparedness
We conducted a webinar on Severe Weather Preparedness where we covered the above topics and more:
- Keep Your Exposure Data Current with quality!
- Overlay Historical Data to Find the Most Exposed Assets
- Detect Accumulation Hotspots
- Assess Multiple Perspectives of Impact From 30+ Data Partners
- Cut Through the Noise – Set Actionable Alerts
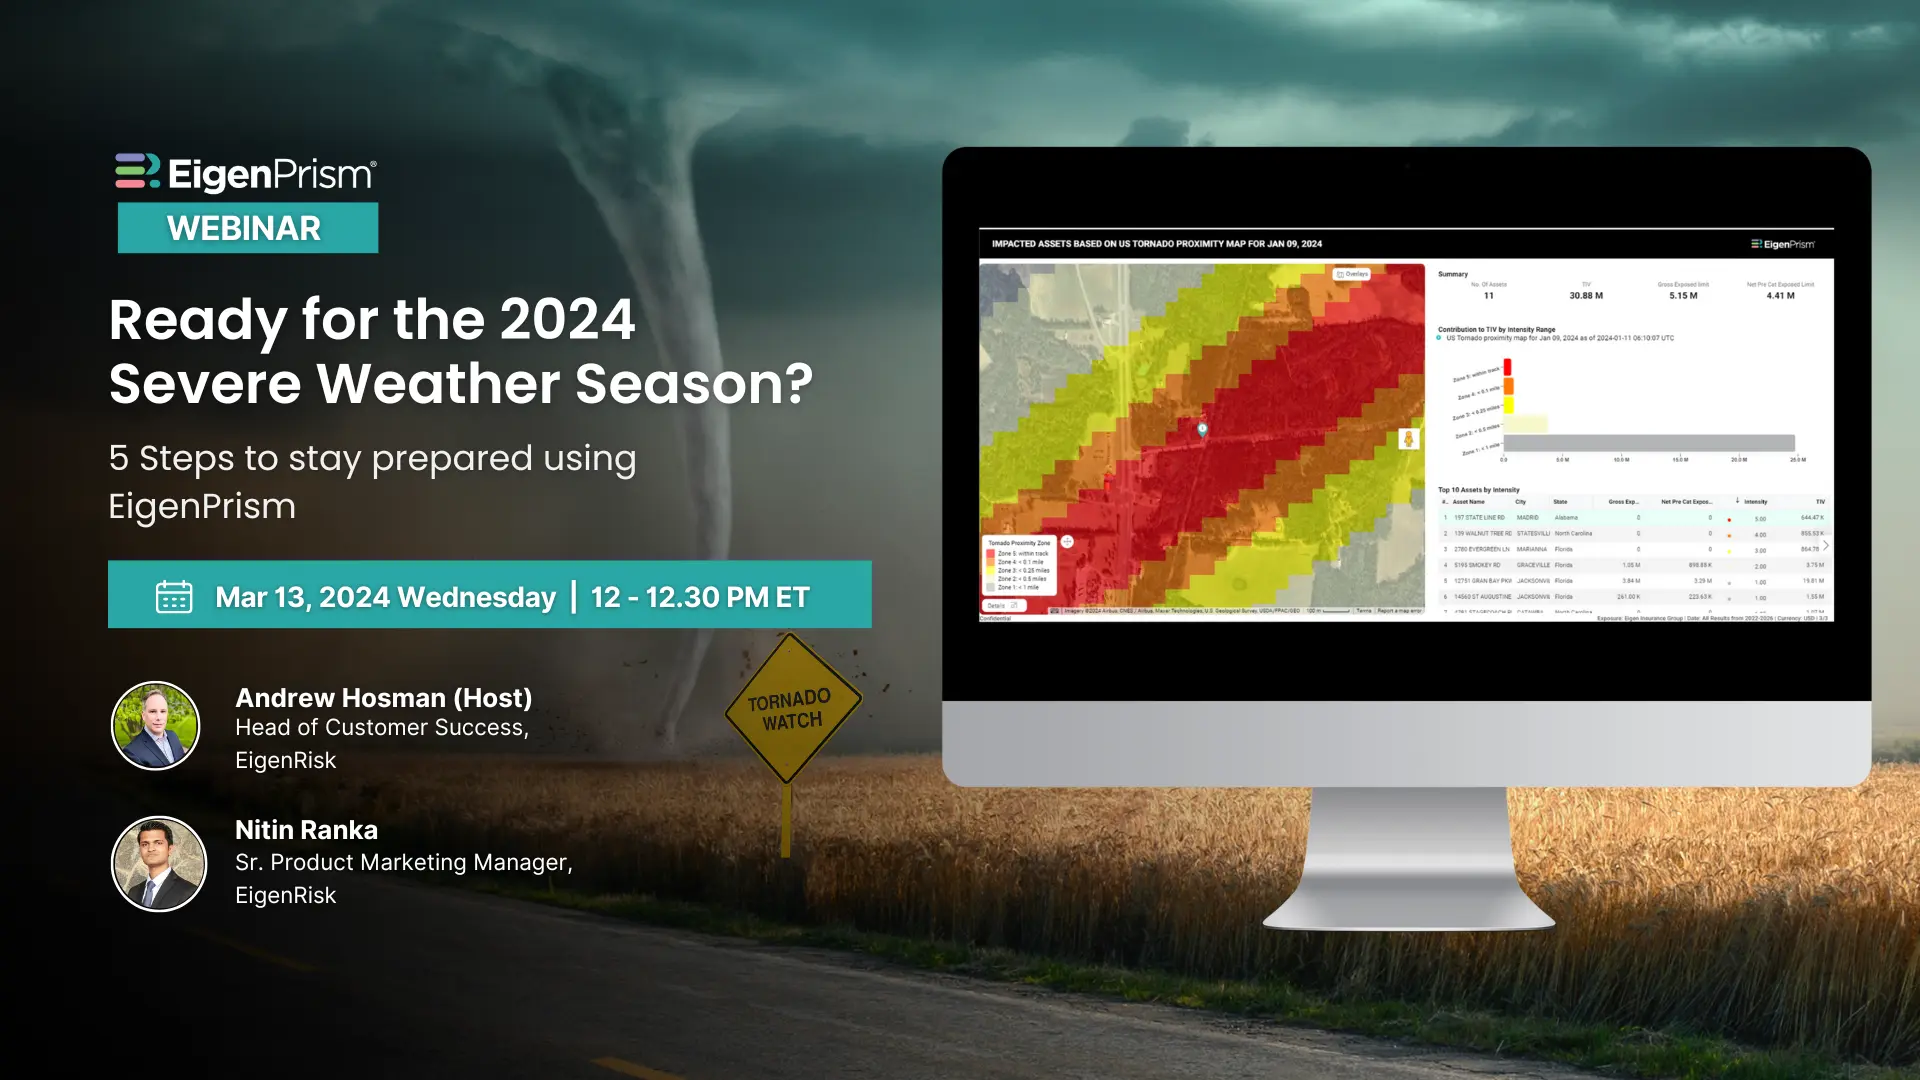
So, if you are more inclined towards viewing a video version of the above, you can watch the webinar.